Integrating With OpenTelemetry
Overview
In this guide, you’ll learn how to leverage Moesif’s OpenTelemetry integration to collect and send trace data of your application to Moesif. It assumes you have basic knowledge of the following:
- OpenTelemetry concepts like traces.
- Node.js
We’ll use a simple Node.js application to demonstrate how to set up OpenTelemetry from scratch in an app and how Moesif’s OpenTelemetry integration works. The application simulates a very basic todo application that supports the following operations:
- Adding a todo
- Removing a todo
- Getting all todos
You’ll also learn how to export trace data to Moesif if you’re using the OpenTelemetry Collector and not instrumenting an application from scratch.
The code this tutorial uses is based on the Moesif OpenTelemetry Node.js example. You can reference the source code of the example if you need more context on how to set up your project that uses OpenTelemetry and Moesif.
Background
The integration works by configuring your OpenTelemetry exporter to send trace data to Moesif using the OTLP/HTTP protocol. Moesif treats each OpenTelemetry HTTP request-response span as an API event, capturing key information like request and response details, user identification, and metadata.
By integrating with OpenTelemetry, you can leverage existing distributed tracing to analyze API performance and user behavior across services and applications.
Objectives
- Instrument Node.js applications using OpenTelemetry Node.js SDK.
- Integrate Moesif with OpenTelemetry.
- Send trace data to Moesif OTLP receiver endpoint.
- Use Moesif to understand and interpret observability traces collected by OpenTelemetry.
Before You Start
- Make sure you have Node.js installed on your system.
- If you’re using the OpenTelemetry Collector, make sure it can export telemetry data in compliance with OTLP/HTTP.
Create your Moesif Account
If you don’t already have a Moesif account, sign up..

After registration, Moesif asks you some details including:
- Organization name
- The name of your organization or company.
- App name
- The name of the app you are integrating with Moesif.
- Your role
- Here you can describe your current role at your organization. This helps Moesif to assist you with relevant hints and tips in the future.
- Your goal
- Here you can let us know how you want to use Moesif to help your organization or project.
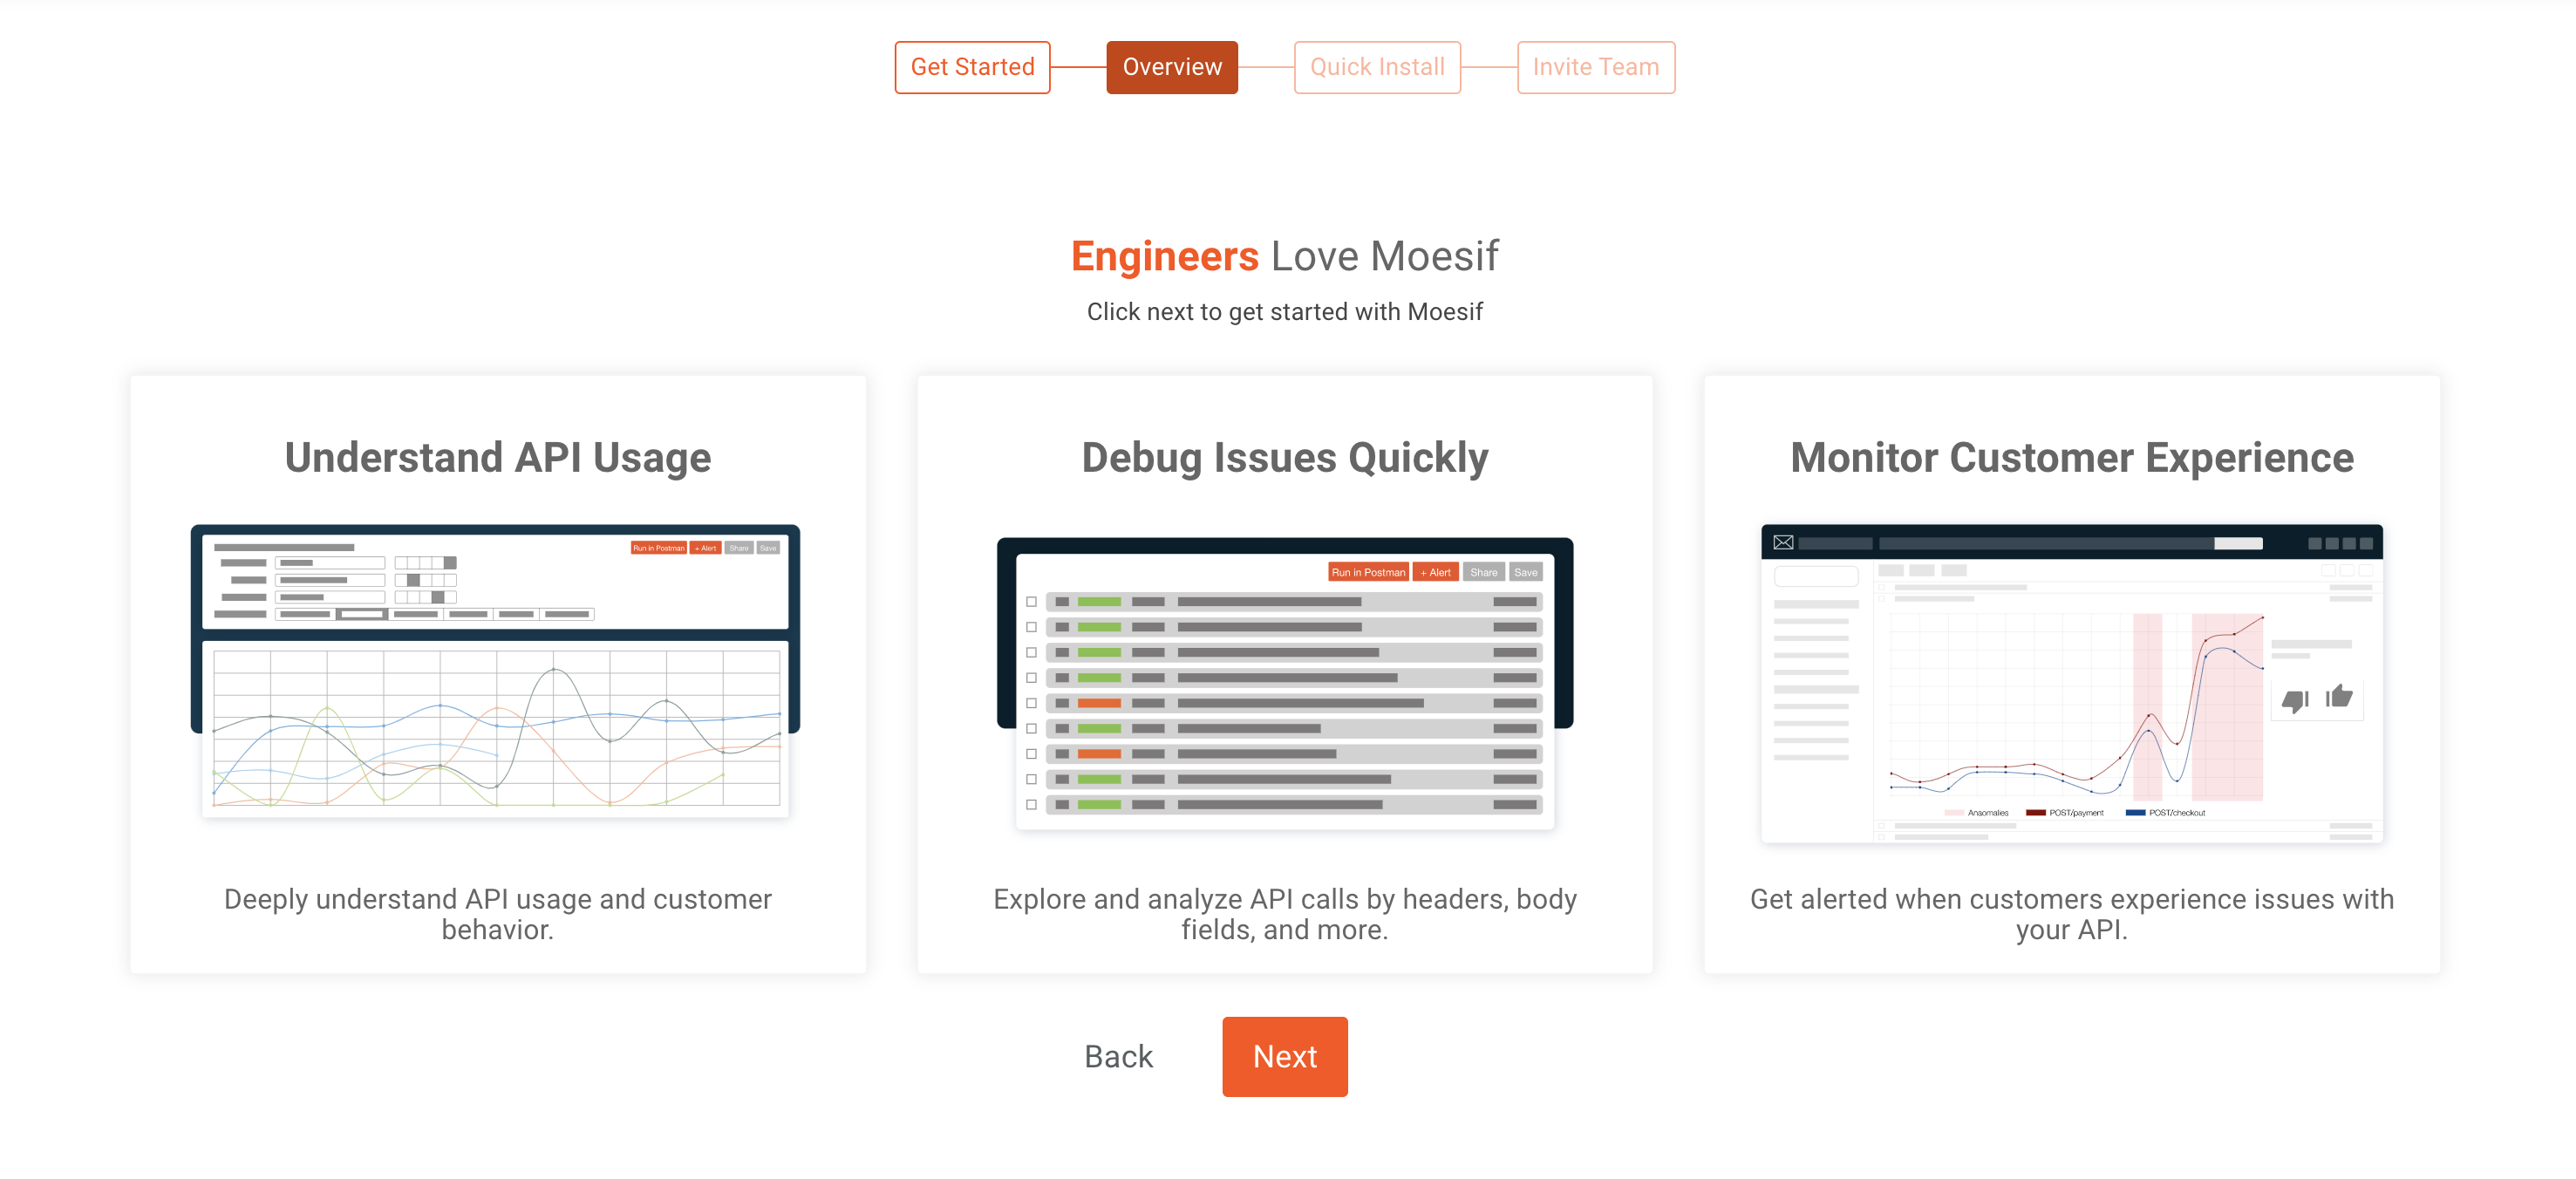
Once you’ve filled out these details, select Next. After this, you’ll see a brief overview of Moesif.

Select Next again to finish the process.
Add Moesif Integration
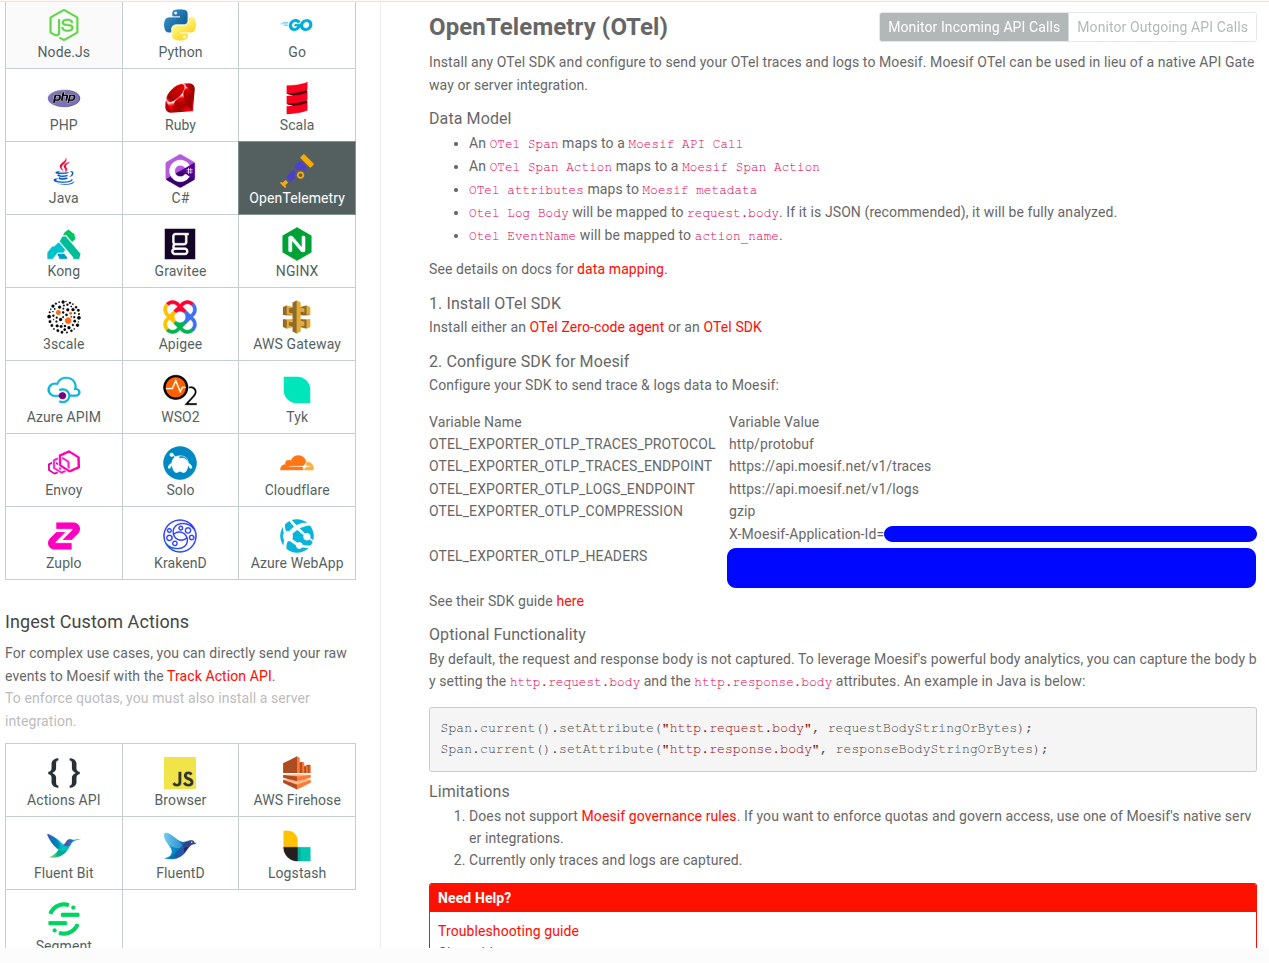
After the overview screen, Moesif shows you an installation screen showing various integration options available. Select OpenTelemetry from the list of server integrations here.

You can also see a notice with a loading animation showing that says Moesif hasn’t received any data yet. This shows that Moesif is now listening for events to come in through the SDK that your are about to install.
Configure the Exporter
For Moesif OpenTelemetry integration, you must configure the exporter to export trace data using the OTLP/HTTP protocol.
For a Node.js application, you must set the following environment variables:
- OTEL_EXPORTER_OTLP_TRACES_PROTOCOL
- OTEL_EXPORTER_OTLP_ENDPOINT
- OTEL_EXPORTER_OTLP_COMPRESSION
- OTEL_EXPORTER_OTLP_HEADERS
For our example Node.js application, create a .env file in the
project root and set these variables
like the following:
OTEL_EXPORTER_OTLP_TRACES_PROTOCOL=http/protobuf
OTEL_EXPORTER_OTLP_ENDPOINT=https://api.moesif.net/v1/traces
OTEL_EXPORTER_OTLP_COMPRESSION=gzip
OTEL_EXPORTER_OTLP_HEADERS=X-Moesif-Application-Id=YOUR_APPLICATION_ID
For OpenTelemetry Collector, specify the the YAML exporter configuration in the following way:
exporters:
  otlphttp:
    endpoint: https://api.moesif.net/v1/traces
    headers:
      X-Moesif-Application-Id: 'YOUR_APPLICATION_ID'
Replace YOUR_APPLICATION_ID with your Moesif Application ID.
During the onboarding process of your sign up, Moesif shows you your Application ID. You can always obtain your Application ID by following these steps any time:
- Log into Moesif Portal.
- Select the account icon to bring up the settings menu.
- Select Installation or API Keys.
- Copy your Moesif Application ID from the Collector Application ID field.
If you’re using OpenTelemetry Collector, the integration completes once you specify the exporter configuration. You can skip to the Observe and Use the Trace Data in Moesif section to see how Moesif displays the trace data it captures.
Install the Dependencies
- Install Express.js and Dotenv:
npm install express dotenv axios - Install the OpenTelemetry SDK libraries:
  npm install \
  @opentelemetry/api \
  @opentelemetry/auto-instrumentations-node \
  @opentelemetry/exporter-metrics-otlp-proto \
  @opentelemetry/exporter-trace-otlp-proto \
  @opentelemetry/instrumentation-http \
  @opentelemetry/sdk-metrics \
  @opentelemetry/sdk-node \
  @opentelemetry/sdk-trace-node \
Add the Instrumentation Code
require("dotenv").config();
const opentelemetry = require("@opentelemetry/sdk-node");
const {
  getNodeAutoInstrumentations
} = require("@opentelemetry/auto-instrumentations-node");
const { ConsoleSpanExporter } = require('@opentelemetry/sdk-trace-node');

const { HttpInstrumentation } = require("@opentelemetry/instrumentation-http");
const { W3CTraceContextPropagator } = require("@opentelemetry/core");
const {
  OTLPTraceExporter
} = require("@opentelemetry/exporter-trace-otlp-proto");
const {
  OTLPMetricExporter
} = require("@opentelemetry/exporter-metrics-otlp-proto");
const { PeriodicExportingMetricReader } = require("@opentelemetry/sdk-metrics");
const { Resource } = require("@opentelemetry/resources");
const {
  ATTR_SERVICE_NAME,
  ATTR_SERVICE_VERSION
} = require("@opentelemetry/semantic-conventions");

const sdk = new opentelemetry.NodeSDK({
  resource: new Resource({
    [ATTR_SERVICE_NAME]: "todos-server",
    [ATTR_SERVICE_VERSION]: "0.1.0"
  }),
  traceExporter: new OTLPTraceExporter({
    url: `https://api.moesif.net/v1/traces`,
    // optional - collection of custom headers to be sent with each request, empty by default
    headers: {}
  }),
  // metricReader: new PeriodicExportingMetricReader({
  //   exporter: new OTLPMetricExporter({
  //     headers: {}, // an optional object containing custom headers to be sent with each request
  //     concurrencyLimit: 1 // an optional limit on pending requests
  //   })
  // }),
  instrumentations: [
    getNodeAutoInstrumentations(),
    new HttpInstrumentation({
      headersToSpanAttributes: {
        client: {
          requestHeaders: [
            "User-Agent",
            "Authorization",
            "X-User-Id",
            "X-Test-Header",
            "X-Company-Id"
          ],
          responseHeaders: [
            "Content-Type",
            "X-User-Id",
            "X-Test-Header",
            "X-Company-Id"
          ]
        },
        server: {
          requestHeaders: [
            "User-Agent",
            "Authorization",
            "X-User-Id",
            "X-Test-Header",
            "X-Company-Id"
          ],
          responseHeaders: [
            "Content-Type",
            "X-User-Id",
            "X-Test-Header",
            "X-Company-Id"
          ]
        }
      }
    })
  ],
  textMapPropagator: new W3CTraceContextPropagator()
});
sdk.start();
Note the following operations that the preceding code performs:
- Imports the necessary packages.
- Creates a new OpenTelemetry Node.js SDK object that contains the
instrumentation configuration.
- Creates a resource that represents the entity OpenTelemetry collects telemetry of—a todo app. So we set two attributes for the resource—the app’s name and a version.
- Defines an exporter where we want to export the trace data to. We want to send the trace data to Moesif’s OTLP-compliant trace receiver endpoint. So we define its URL.
- Defines the specific instrumentations we want for the app
- Initializes and registers the SDK object with the OpenTelemetry API.
Write the Application Logic
require('dotenv').config();
const express = require("express");
const app = express();
const port = 6060; // You can change the port if needed
const axios = require('axios');
const { trace, context } = require('@opentelemetry/api');

const tracer = trace.getTracer('todos-server');

// Sample todo data (You'd likely use a database in a real application)
let todos = [
  { id: 1, task: "Learn Node.js", completed: false },
  { id: 2, task: "Build a REST API", completed: true }
];

const delay = (ms) => new Promise((res) => setTimeout(res, ms));

// fake database calls
async function fetchAllToDoesFromDB() {
  const currentSpan = trace.getSpan(context.active());
  // display traceid in the terminal
  console.log(`starting fetchingAllToDoesFromDB: traceid: ${currentSpan.spanContext().traceId} spanId: ${currentSpan.spanContext().spanId}`);

  const span = tracer.startSpan('fetching-todos');

  console.log(`starting new span fetchingAllToDoesFromDB: traceid: ${span.spanContext().traceId} spanId: ${span.spanContext().spanId}`);

  await delay(16);
  span.end();
  return todos;
}

async function deleteFromDb(id) {
  await delay(5);
  todos = todos.filter((t) => t.id !== parseInt(req.params.id));
  return;
}

async function getRemoteTodos() {
  const response = await axios.get('https://jsonplaceholder.typicode.com/todos');
  return response.data;
}

async function getRemotePosts() {
  const response = await axios.get('https://jsonplaceholder.typicode.com/posts');
  return response.data;
}

// Enable parsing JSON in request bodies
app.use(express.json());

// GET /todos - Get all todos
app.get("/todos", async (req, res) => {
  const currentSpan = trace.getSpan(context.active());
  // set attributes to identify user or company
  currentSpan.setAttribute('user.id', 'abcdefg');
  currentSpan.setAttribute('company.id', 'company1');
  // can also add additional field value here.
  currentSpan.setAttribute('additional_metadata_field', 'foobar');
  // You can also capture the request and response payloads by setting the `http.request.body` and `http.response.body` attributes
  currentSpan.setAttribute("http.request.body", JSON.stringify(req.body));
  currentSpan.setAttribute("http.response.body", JSON.stringify(res.body));
  // if you apply sampling, set the weight attribute
  const sampleRate = 0.5;
  const weight = Math.round(1.0 / sampleRate);
  currentSpan.setAttribute("weight", weight);

  const posts = await getRemotePosts();
  console.log('got posts remotely : ' + posts?.length);

  // display traceid in the terminal
  console.log(`staring api call: traceid: ${currentSpan.spanContext().traceId} spanId: ${currentSpan.spanContext().spanId}`);
  return tracer.startActiveSpan("load-data", async (span) => {
    span.setAttribute('data', 'foobar');
    console.log(`starting span in api hanlder: traceid: ${span.spanContext().traceId} spanId: ${span.spanContext().spanId}`);
    const data2 = await getRemoteTodos();
    console.log('got todos from data2: ' + data2?.length);
    span.addEvent('start-loading', { you: 'cool'});
    const data = await fetchAllToDoesFromDB();
    res.json(data);
    span.addEvent('finished-responding', { foo: 'bar'});
    span.end();
  });
});


// POST /todos - Create a new todo
app.post("/todos", (req, res) => {
  return tracer.startActiveSpan("add-todo", (span) => {
    // Be sure to end the span!

    const newTodo = {
      id: todos.length + 1,
      task: req.body.task,
      completed: false
    };

    todos.push(newTodo);
    res.status(201).json(newTodo);
    span.end();
  });
});

// DELETE /todos/:id - Delete a todo
app.delete("/todos/:id", async (req, res) => {
  await deleteFromDb(parseInt(req.params.id));
  res.status(204).send(); // 204 No Content
});

app.listen(port, () => {
  console.log(`Todo API server listening on port ${port}`);
});
Run the Instrumented Application
You must run and load the instrumentation setup and configuration before your application code. We can achieve that by using the --require flag in Node.js:
node --require ./instrumentation-moesif.js app.js
Here we use the --require flag to load the instrumentation code before the
application code.
Observe and Use the Trace Data in Moesif
If you’ve completed the steps so far successfully, the app runs at
http://localhost:6060. Make some requests and you can see in your terminal
the trace data of your app:
Todo API server listening on port 6060
got posts remotely : 100
staring api call: traceid: 4b58bac808781e9ee56ac14cebfb8a0d spanId: 235edcd30c08e090
starting span in api hanlder: traceid: 4b58bac808781e9ee56ac14cebfb8a0d spanId: ece9bfbabafcc660
got todos from data2: 200
starting fetchingAllToDoesFromDB: traceid: 4b58bac808781e9ee56ac14cebfb8a0d spanId: ece9bfbabafcc660
starting new span fetchingAllToDoesFromDB: traceid: 4b58bac808781e9ee56ac14cebfb8a0d spanId: 731caffae9a1b1bc
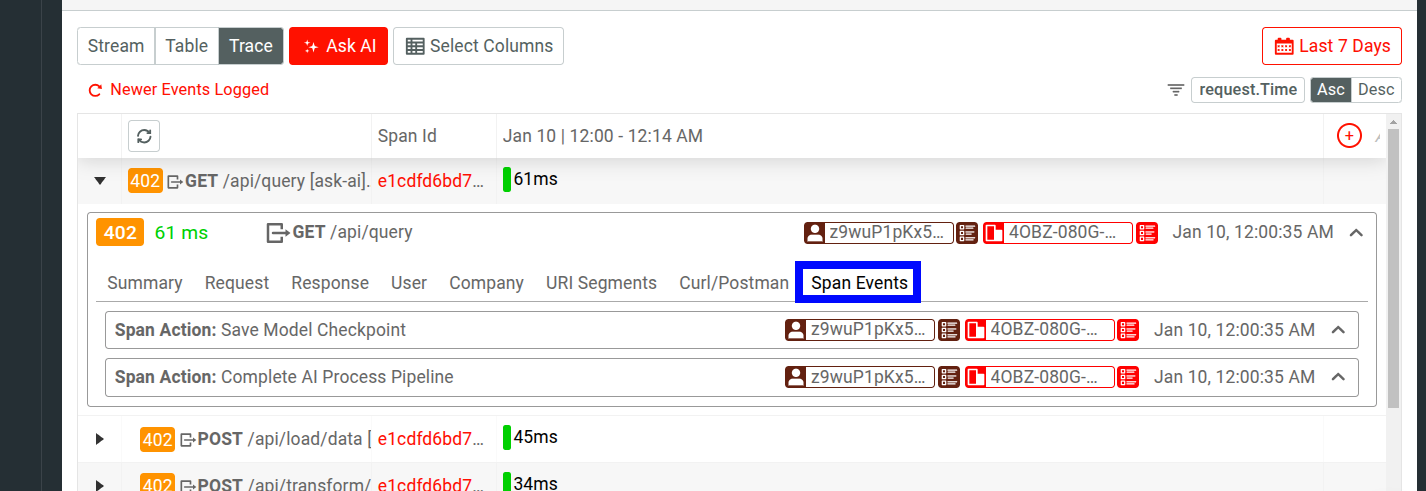
In your Moesif Portal, you can see the trace data Moesif has captured for the requests:

For OpenTelemetry-instrumented apps, Moesif also collects trace data in a separate Trace view for Live Event Log workspaces.

In the expanded menu for an event, you can go to Span Events to view Span Event data for the span.

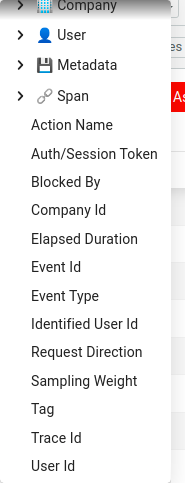
You can also use different trace data elements as filters like trace ID and spans.

Span Action Events
If you add events to your spans using Span.addEvent(...), Moesif captures them as span_action events. Unlike the main api_call spans, these span_action events provide internal details such as database queries, checkpoints, or custom annotations that occur during the request. You can filter or explore these in the Moesif UI alongside your main API events.
Troubleshoot
- Data not appearing in Moesif
- Make sure you’ve correctly configured your OpenTelemetry exporter with the Moesif endpoint and Application ID and that your traces include HTTP spans.
- Authentication errors
- Verify that you’ve correctly set your Moesif Application ID.
- Incomplete data
- If you see certain fields not appearing, make sure that you have correctly added custom span attributes where necessary.