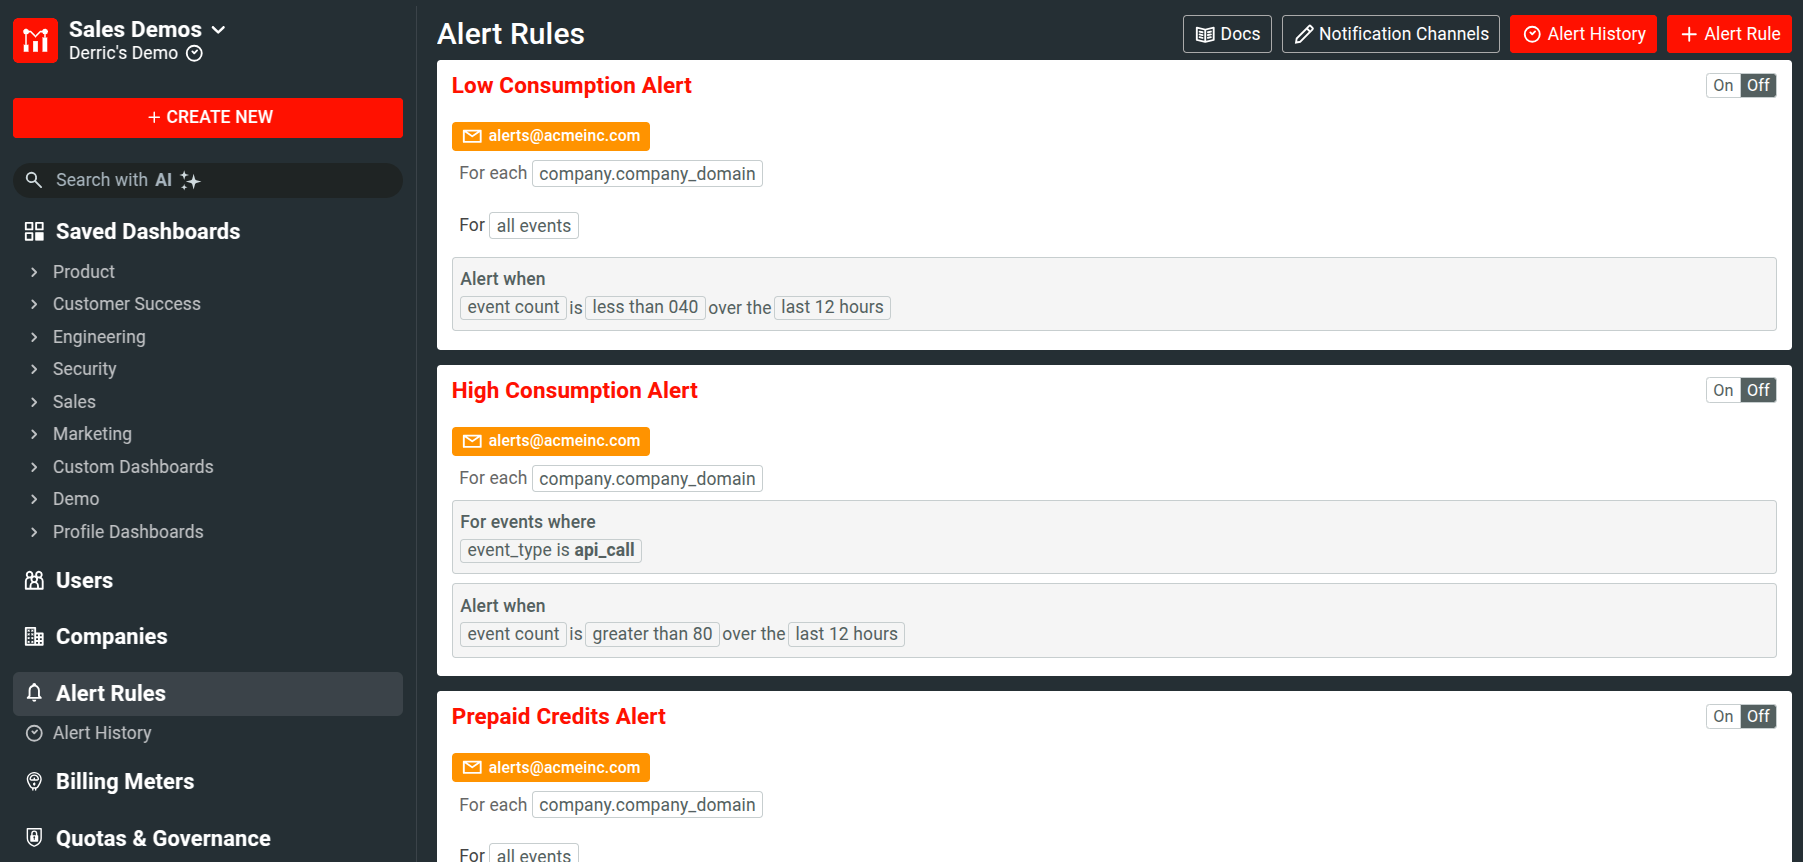
Viewing Alert Rules
This guide assumes you are familiar with Alerts already. If not, please review API Monitors & Alerts.
Alerting
You can find a full list of your alerts in the Alert Rules page. Here you can see an overview of your alerts, as well as access the notification channels.
Channels
To view the notification channels for your alerts, select ![]() Notification Channels. This page contains details about current channels in your application and allows you to create new ones. For more information, see Creating Notification Channels.
Notification Channels. This page contains details about current channels in your application and allows you to create new ones. For more information, see Creating Notification Channels.
Alert Details
You can turn on or off individual alerts using the On-Off toggle.
To delete an alert, select ![]() Delete.
Delete.
To access the details of an alert, select the alert title or ![]() Edit. From this page, you can edit and reconfigure your alert.
Edit. From this page, you can edit and reconfigure your alert.
Alert Detail View
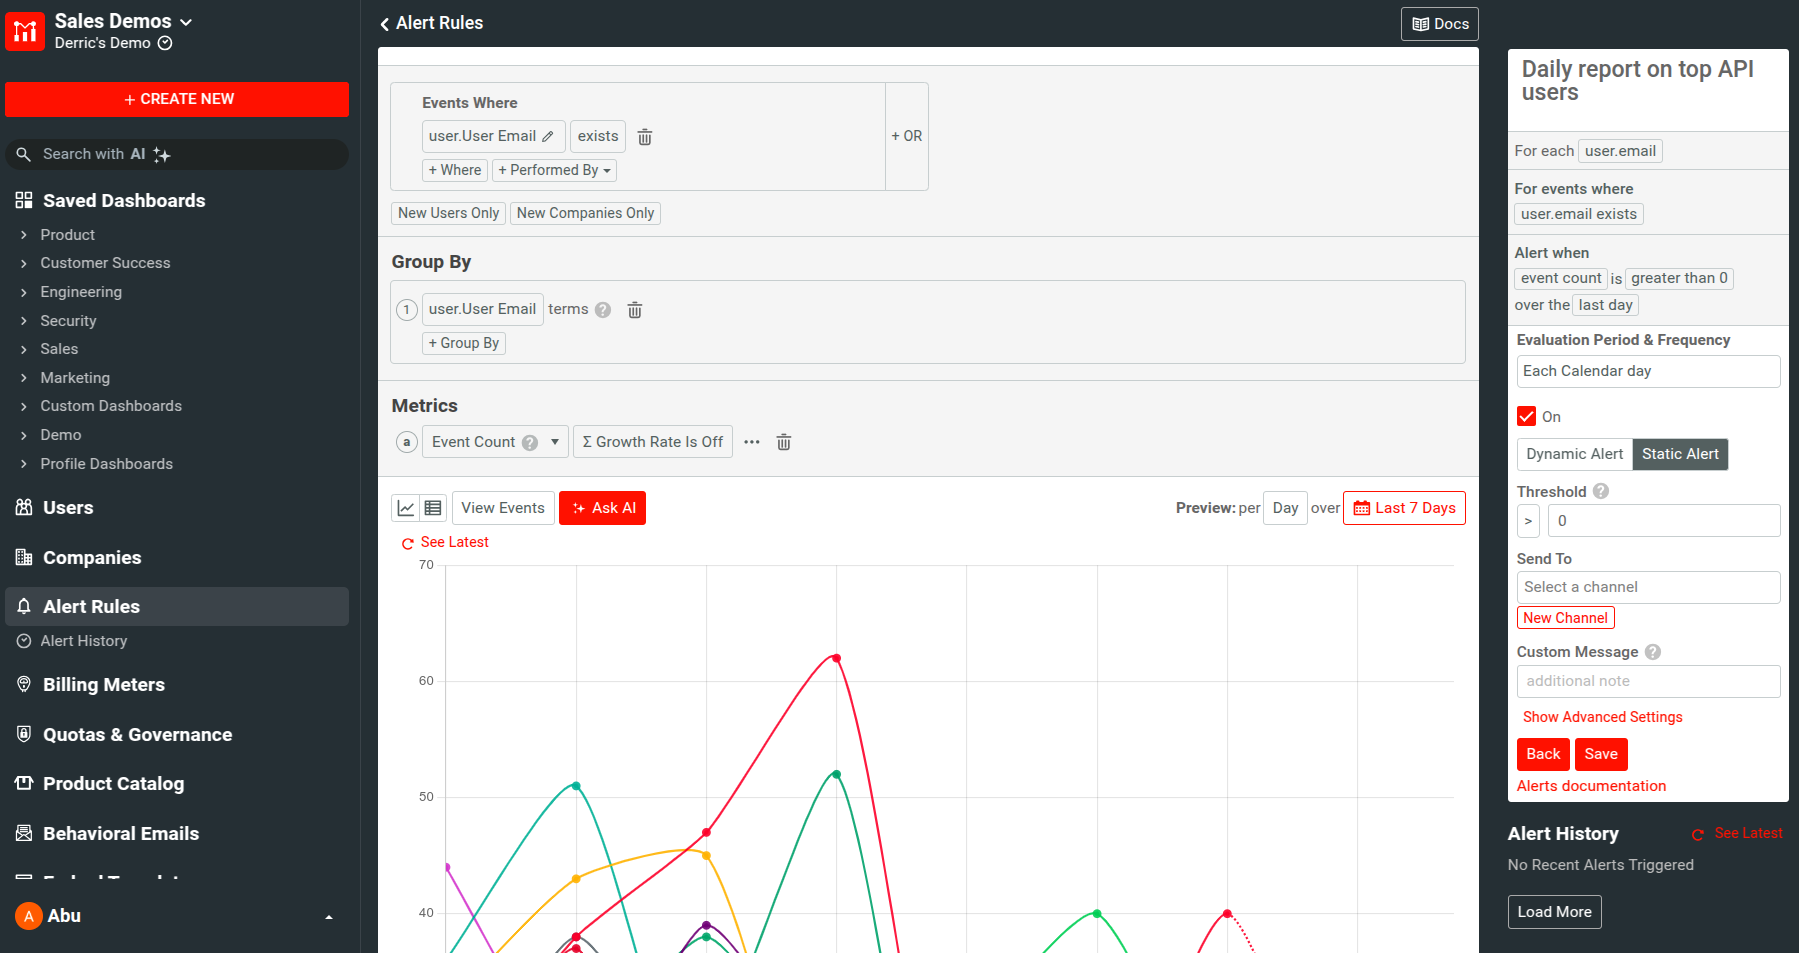
The alert details page allows you to see the time series chart of your alert, as well as the alert rules and settings for the alert.
You can modify an alert by adjusting the different alert rule options and settings displayed in this page. For example, adding a new channel adds a new channel to this alert. Similarly, modifying the API filters or the tracking metrics updates the alert rules for the alert. After you’ve added your changes, select Save. For more information about this page, see Creating Alert Rules.
Alert History
The  Alert History pane in the Alert Rules section shows the recent history of all active alerts that has been triggered, including deleted alerts.
By default, Alert History shows alert history for all active channels and alert rules. From the Filters pane, you can filter the history by channels and alert rules.
Alert History Information
| Column | Description |
| Alert name | The alert name |
| Status | Whether the alert is active or deleted. |
| Channel | The channels configured to get notifications for this alert. |
| Notification status | Whether notification has been sent successfully to channels or was suppressed due to a silence or downtime period. |
| Time | The UTC time and date for the trigger. |
Selecting on the name of the alert takes you to its Alert Rule page where you can view and edit the alert rule. Selecting anywhere else opens up a pane with more details about the triggered alert:
- The corresponding metric, metric value, and metric graph triggering the alert.
- Any metadata that you may have attached.
- Number of supperesed alerts during a silence or downtime period.
- Any custom message you may have attached to the alert rule.