Viewing Dashboards
This page describes how to view, configure and use dashboards.
Both Full-Access Team Members and Dashboard Viewers seats can access and use dashboards.
Open workspaces
You can open a workspace by selecting its name in the workspace tile of the dashboard. You can also open a worksapce from the navigation menu by expanding a dashboard dropdown and selecting the workspace name.
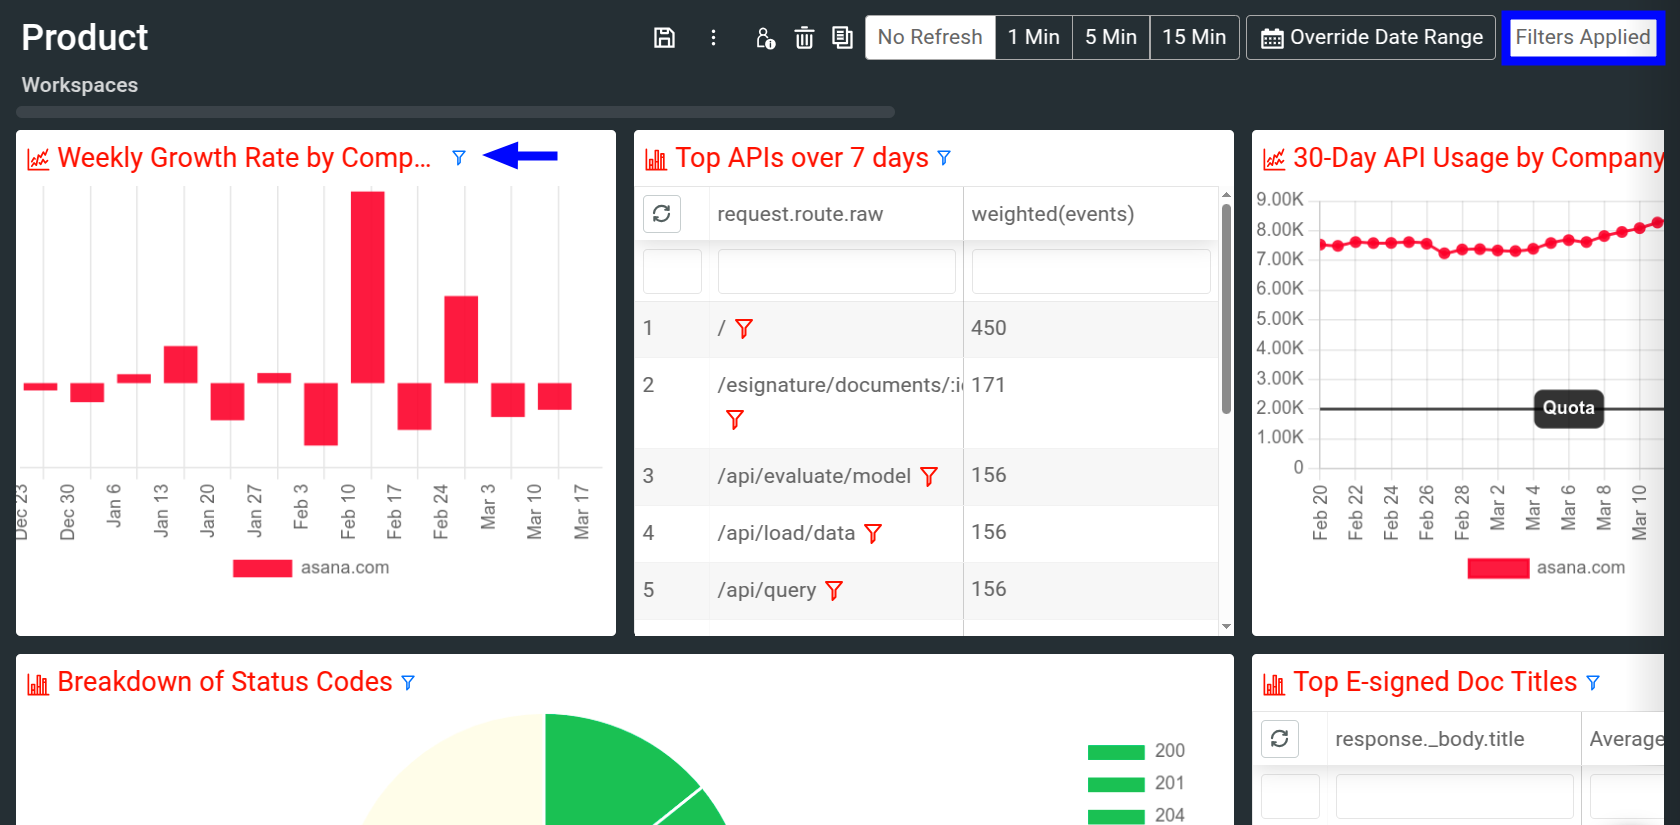
Refresh interval
By default, dashboards do not reload or refresh to reflect the latest data that has come in. However, you can select a time interval for when you want the dashboard to refresh. This can prove useful in real-time scenarios, for example, if a TV in the office features the dashboard and you want it to always stay up-to-date.
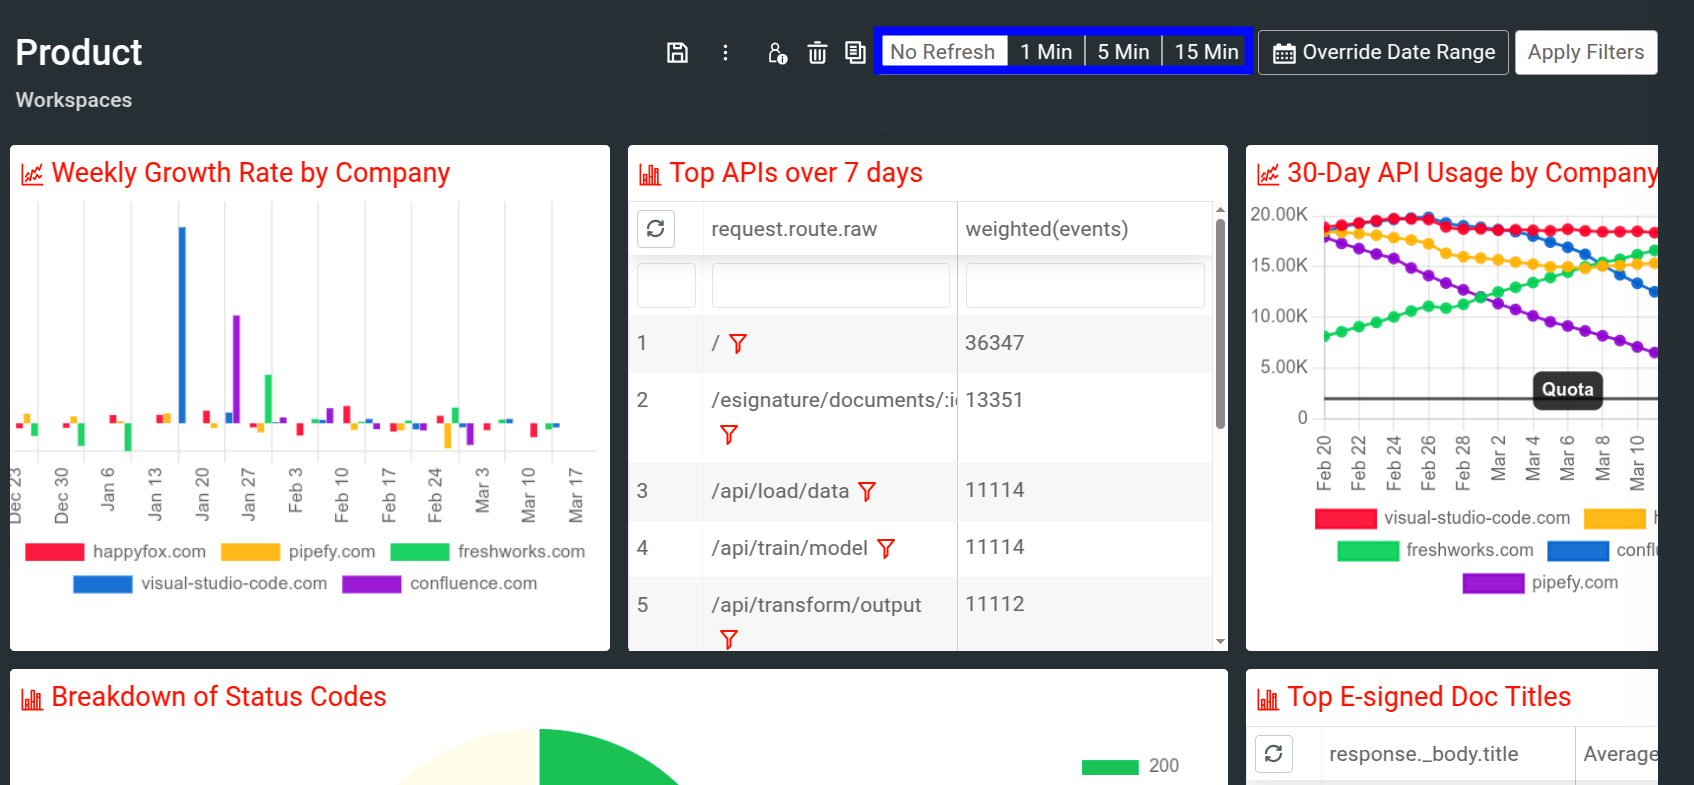
Override date Range
You can quickly override the date range of all workspaces within a dashboard by selecting Override Date Range. By default, each chart uses the date range associated with the chart.
The date range you apply here applies to all workspaces in a dashboard, regardless of whether a dashboard currently has a date range in its filter.
Overriding date range makes it easy to toggle the same dashboard between different ranges.
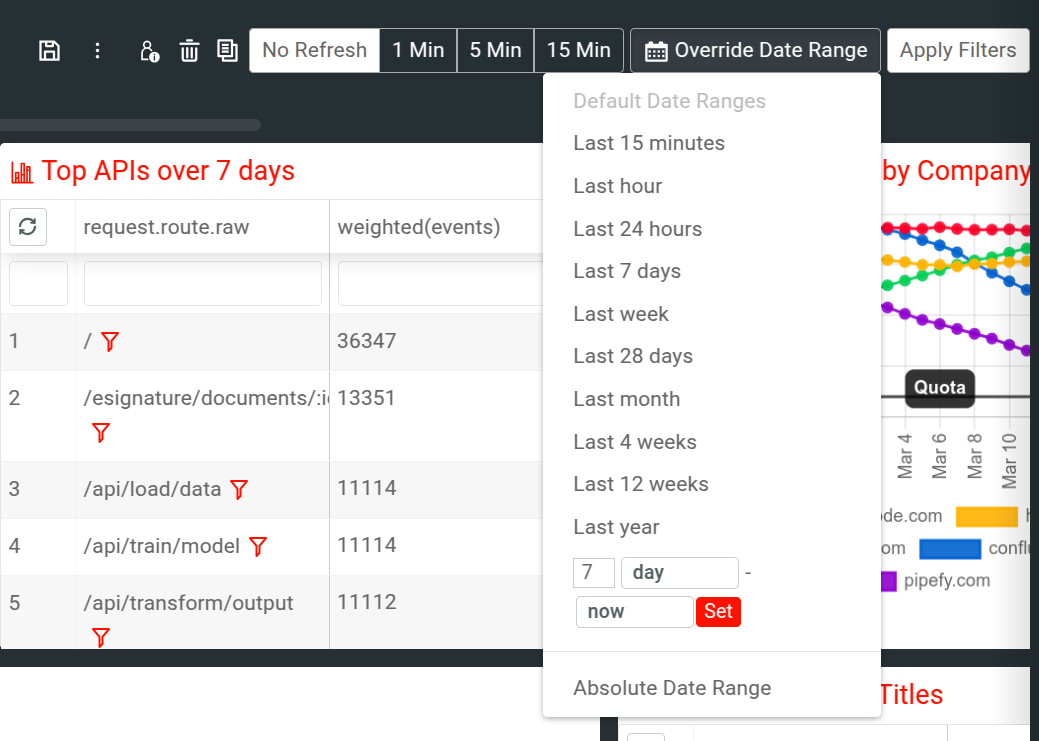
By default, the dashboard uses the Default Date Ranges date range. These are default ranges specified for the metrics in each individual workspace in the dashboard.
The following predefined date ranges are available:
- Last 15 minutes
- Last hour
- Last 24 hours
- Last 7 days
- Last week
- Last 28 days
- Last month
- Last 4 weeks
- Last 12 weeks
- Last year
By selecting Custom, you can specify a particular relative date range not available in the preceding date ranges. If you want more precise time control, choose an absolute date range from Absolute Date Range.
Last Month refers to the first day of the previous month and ends at the current date. To specify previous calendar month, do one of the following:
- Specify either a custom date range with the previous number of days and now.
- Use an absolute date range with the two dates.
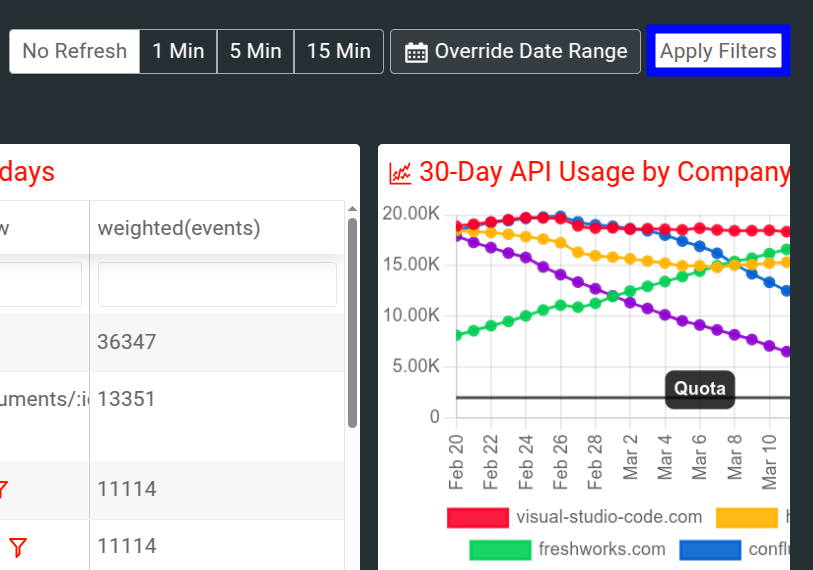
Apply Additional Filters
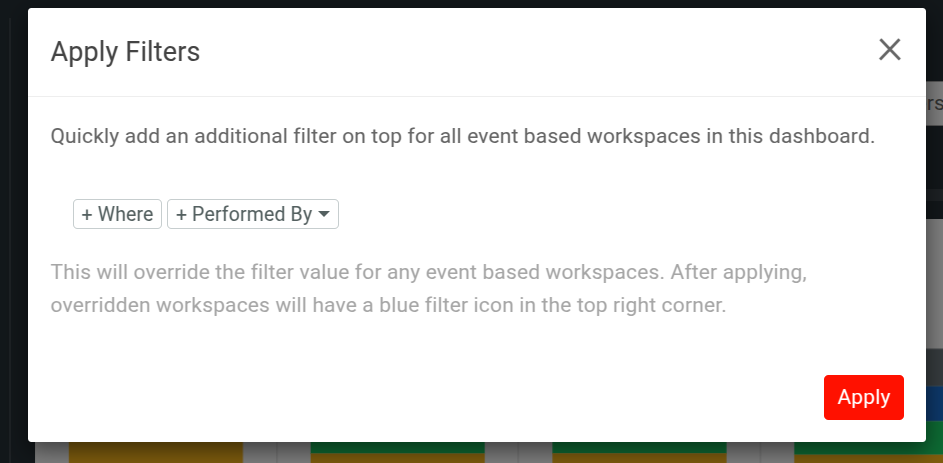
You can add filters to the dashboard by selecting Apply Filters. This filter aplies to all workspaces of the dashboard.
Before you apply a global filter in a dashboard, make sure a workspace doesn’t already have the same filter applied to avoid conflicts.
A common use case for the filter override is to easily filter for a specific product or customer ID while having a common dashboard containing all KPIs (key performance indicators). With this feature, you don’t have to manually create a dashboard for each customer.
Moesif also has profile dashboards that have been designed specifically for customer-facing teams to have a one spot to see a customer’s usage metrics, profile, and billing information.
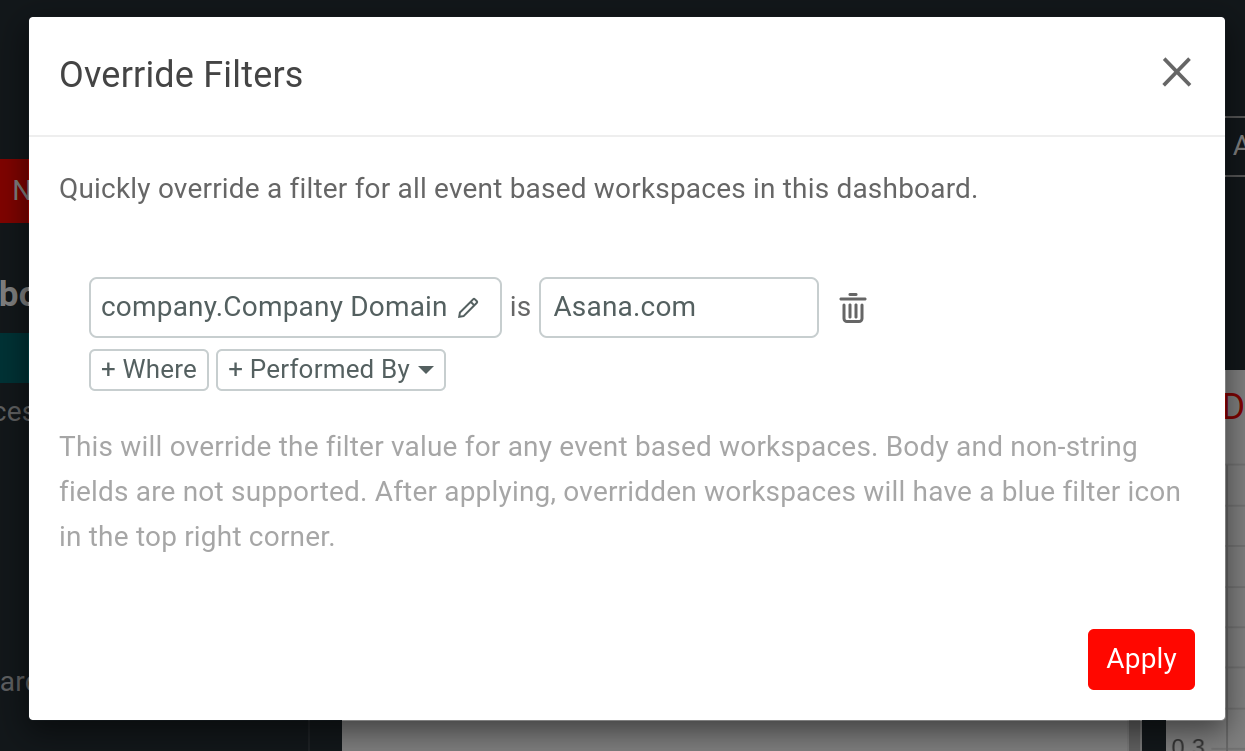
When you add a filter to a dashboard, a blue filter funnel icon appears in the workspace tiles of that dashboard.
Workspace tile options
You hover over a workspace tile in a dashboard for additional options:
- View Expanded
- Open the workspace in detailed view in the current browser tab.
- Show Detailed Info
- View information like workspace owner, workspace type for sharing, and the analysis time period.
- Open in New Tab
- Open the workspace in a new browser tab.
- Delete
- Delete the workspace.