How to Best Monitor Kong Performance and API Usage with the Moesif API Analytics Plugin
Kong is a highly recommended API Gateway for any team looking for a reliable and scalable way to provide APIs. Compared to more traditional players like Apigee and Mulesoft, Kong follows an open-core model and is highly modular.
To best optimize your API performance and understand what changes are needed to recoup your investment, it’s recommended to set up an API observability and monitoring system like Moesif. While traditional monitoring answers known unknowns like Requests Per Minute or status like Red, Yellow Green, you need to know ahead of time what to probe and measure such as to increment performance counters. Capturing and analyzing API requests as part of the API observability and monitoring system can help identify issues, understand the flow of data, and resolve potential problems before they impact end users. API observability on the other hand is a trend that enables business and engineering teams to observe and answer unknown unknowns. These arbitrary questions arise from the requirements to solve complex engineering and business challenges quickly.
Moesif has published a Kong plugin to enable you to add API observability and monitor your APIs from a central spot, your API gateway, without adding any performance penalty to your APIs. The question then, what are the key things you should be monitoring?
Developing an API Observability Strategy
Crafting a robust API monitoring strategy is crucial for maintaining the reliability and performance of your APIs. A well-rounded strategy should encompass monitoring key metrics such as request latency, error rates, response times, throughput, and availability. Setting up alerts and notifications for predefined thresholds allows developers to proactively address potential issues before they escalate. Additionally, continuous review and improvement of the monitoring approach ensure it remains aligned with the evolving needs of the business. By adhering to best practices like real-time monitoring, utilizing comprehensive monitoring tools, and regularly refining the strategy, developers can ensure their APIs are consistently available and highly performant. This proactive approach not only safeguards the API’s functionality but also enhances the user experience.
Introduction to Kong Gateway and Plugins
Kong Gateway stands out as a lightweight, fast, and flexible cloud-native API gateway, providing a unified platform for SaaS end-to-end connectivity. It supports multi-LLM AI Gateway for GenAI infrastructure and is built on Kuma and Envoy for enterprise service mesh. One of the key strengths of Kong Gateway is its extensive range of plugins that extend its functionality. These plugins cover various aspects such as authentication, security, traffic control, serverless, analytics & monitoring, transformations, and logging. By leveraging these plugins, developers can build custom integrations and manage their APIs more effectively, ensuring a seamless and secure API management experience. Whether you need to implement basic auth, enhance security, or monitor API usage, Kong Gateway’s plugins offer the flexibility and power to meet your needs.
Moesif API Analytics Plugin for Kong Gateway
The Moesif API Analytics Plugin for Kong Gateway is a powerful tool designed to provide deep insights into API performance and behavior. By integrating Moesif with Kong Gateway, developers can gain comprehensive visibility into their API traffic, including detailed metrics on API endpoints, request and response times, body payloads, error rates, and more. The plugin also offers business analytics to help you grow your API business such as around adoption, revenue, and cost of various APIs. These capabilities enable developers to identify performance bottlenecks, troubleshoot issues, and optimize their APIs for better performance. With Moesif, you can ensure your APIs are running smoothly and efficiently, providing a better experience for your users and maximizing the value of your API infrastructure.
Engineering Metrics
The first API metrics that come to mind are functional and performance metrics. Kong, like many API gateways and proxy servers, are designed for high-throughput APIs and can scale to extremely high requests per minute, but most performance issues are due to application slowness, not your Kong infrastructure. Unless you have full control over how API consumers query your API, you’ll run into obscure queries that place additional strain on your data stores and processing. A small group of API consumers who perform a few too many full scans or large joins can slow your API infrastructure. Observability tools enhance the debugging and troubleshooting process by offering a comprehensive view of API interactions.
Average latency can be deceiving
You might think average latency is the first thing you should be tracking, but average API latency is deceiving. High average latency that’s consistent may be fine. Latency that varies by the hour or when the blue moon is out can be detrimental for your customers. Track the 90th percentile latency, then further break down by endpoint or customer. A modern API analytics solution like Moesif for Kong enables you to tie API calls back to individual users and then enrich those users with customer demographics
You should have the ability to slice and dice 90th percentile latency by any number of API call parameters such as the endpoint, specific query parameters, and even body fields.
Monitor actual application errors
Once you get a hold of Kong’s 90th percentile latency, time to also look at how error rates are trending. Errors can mean a multitude of different things. At a high level, an error could occur whenever the HTTP status is greater than 400 as reported by Kong and Moesif.
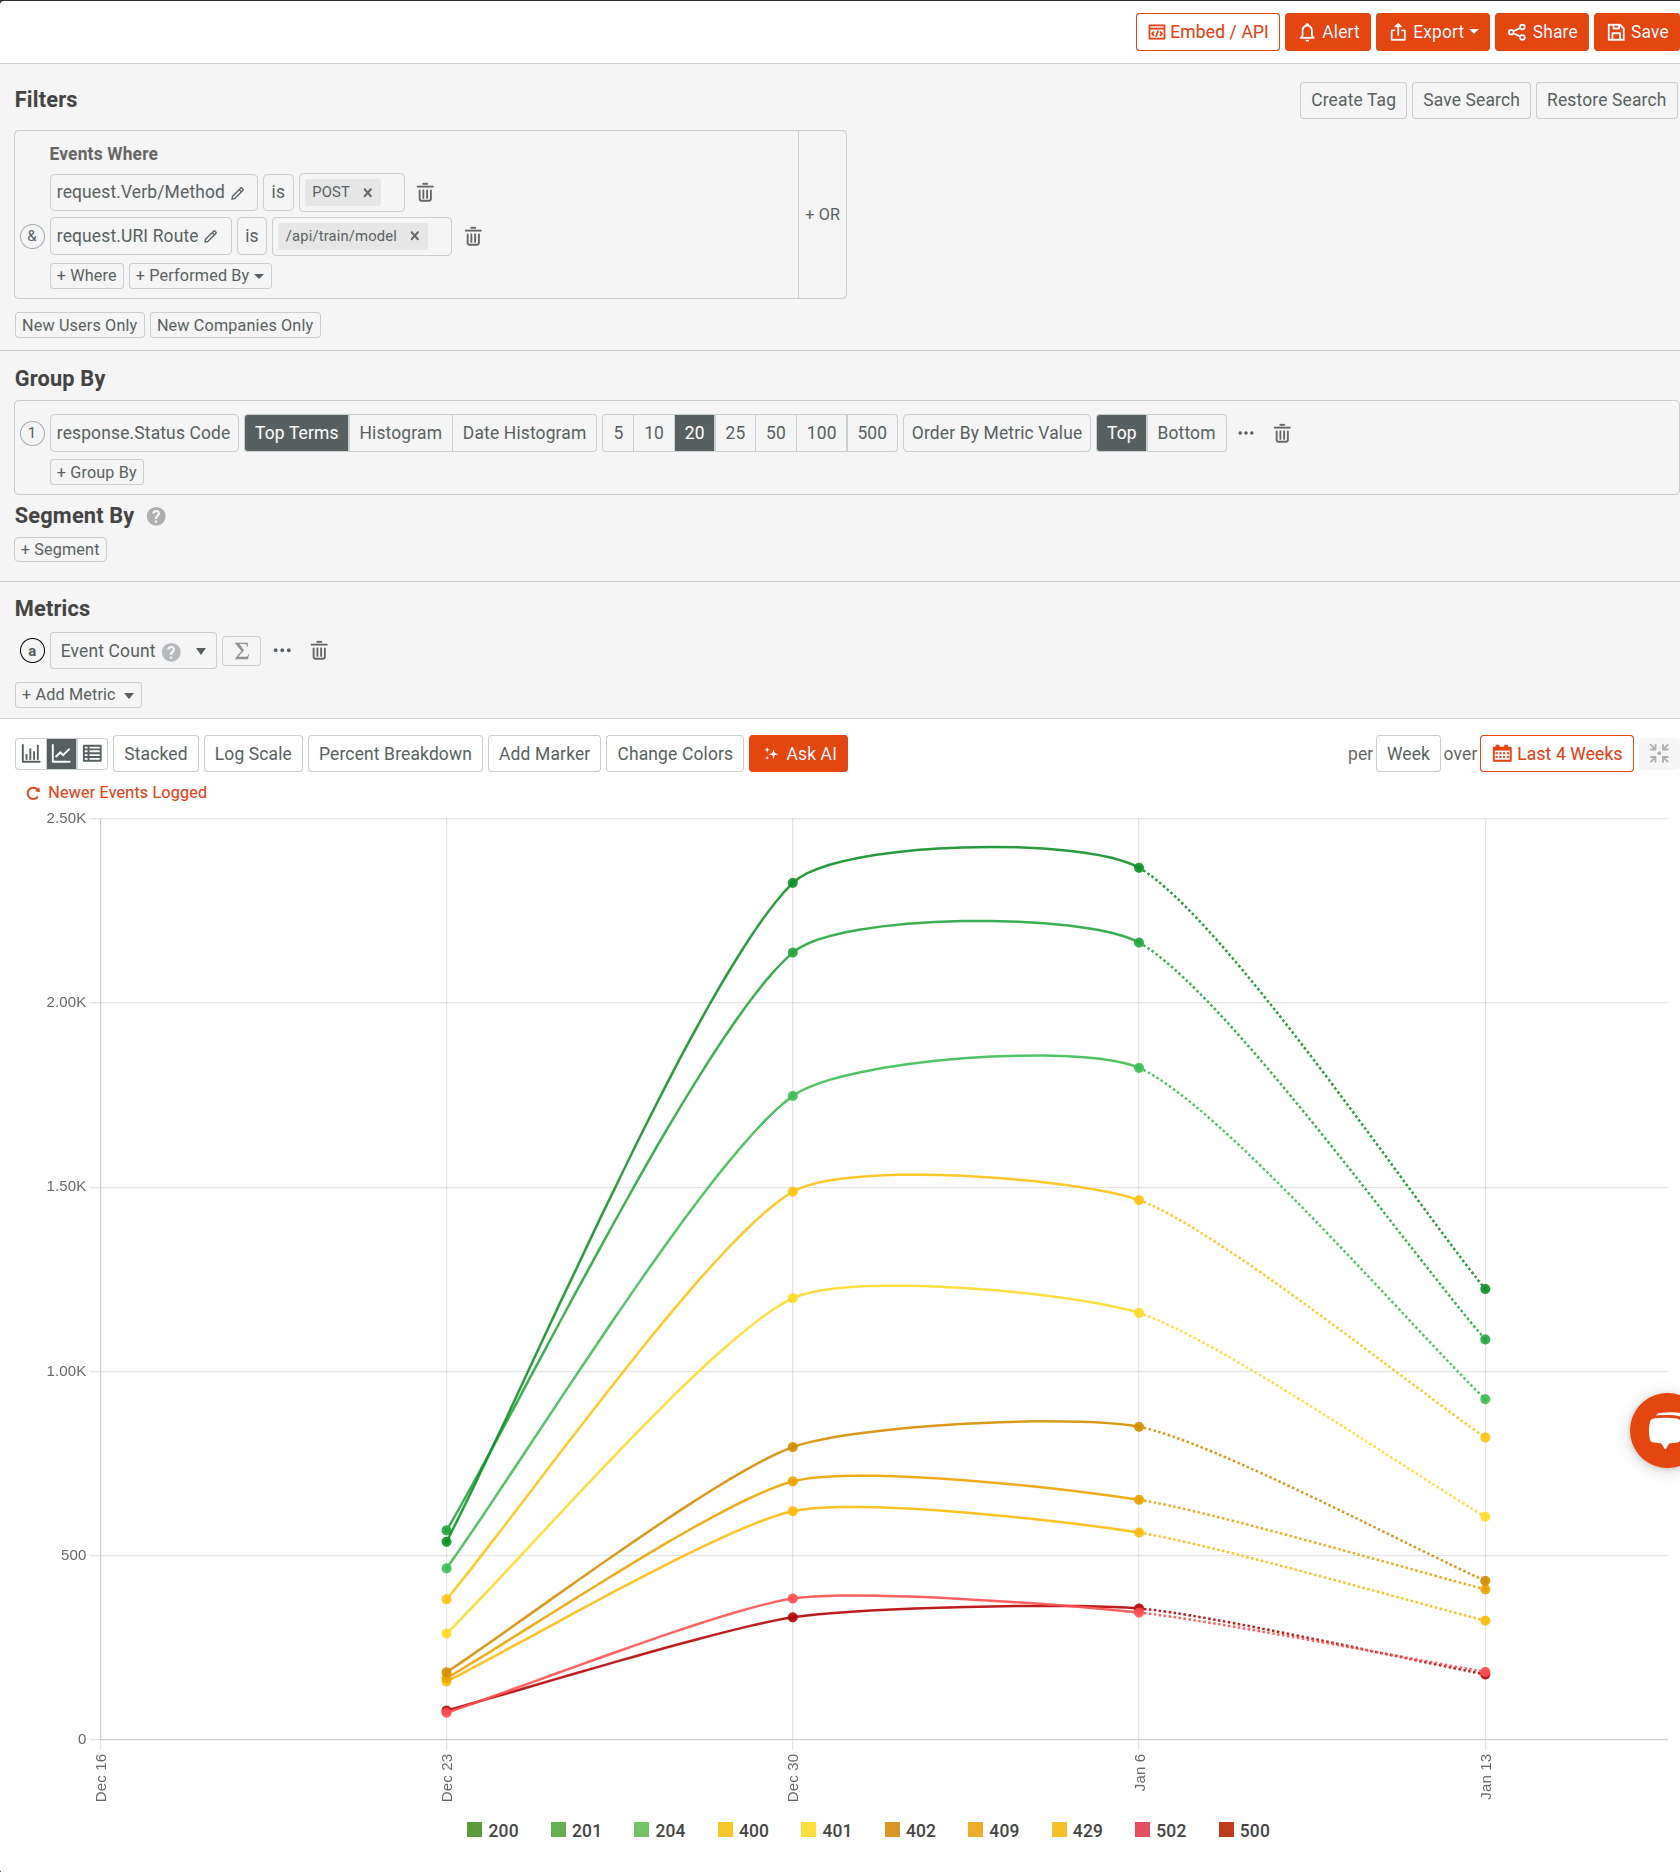
To monitor or create an alert on a Kong metric in Moesif, you can click the alert button at the top. This brings up a window where you can configure where to send the alert and confirm any filters and group by’s that you want in the alert.
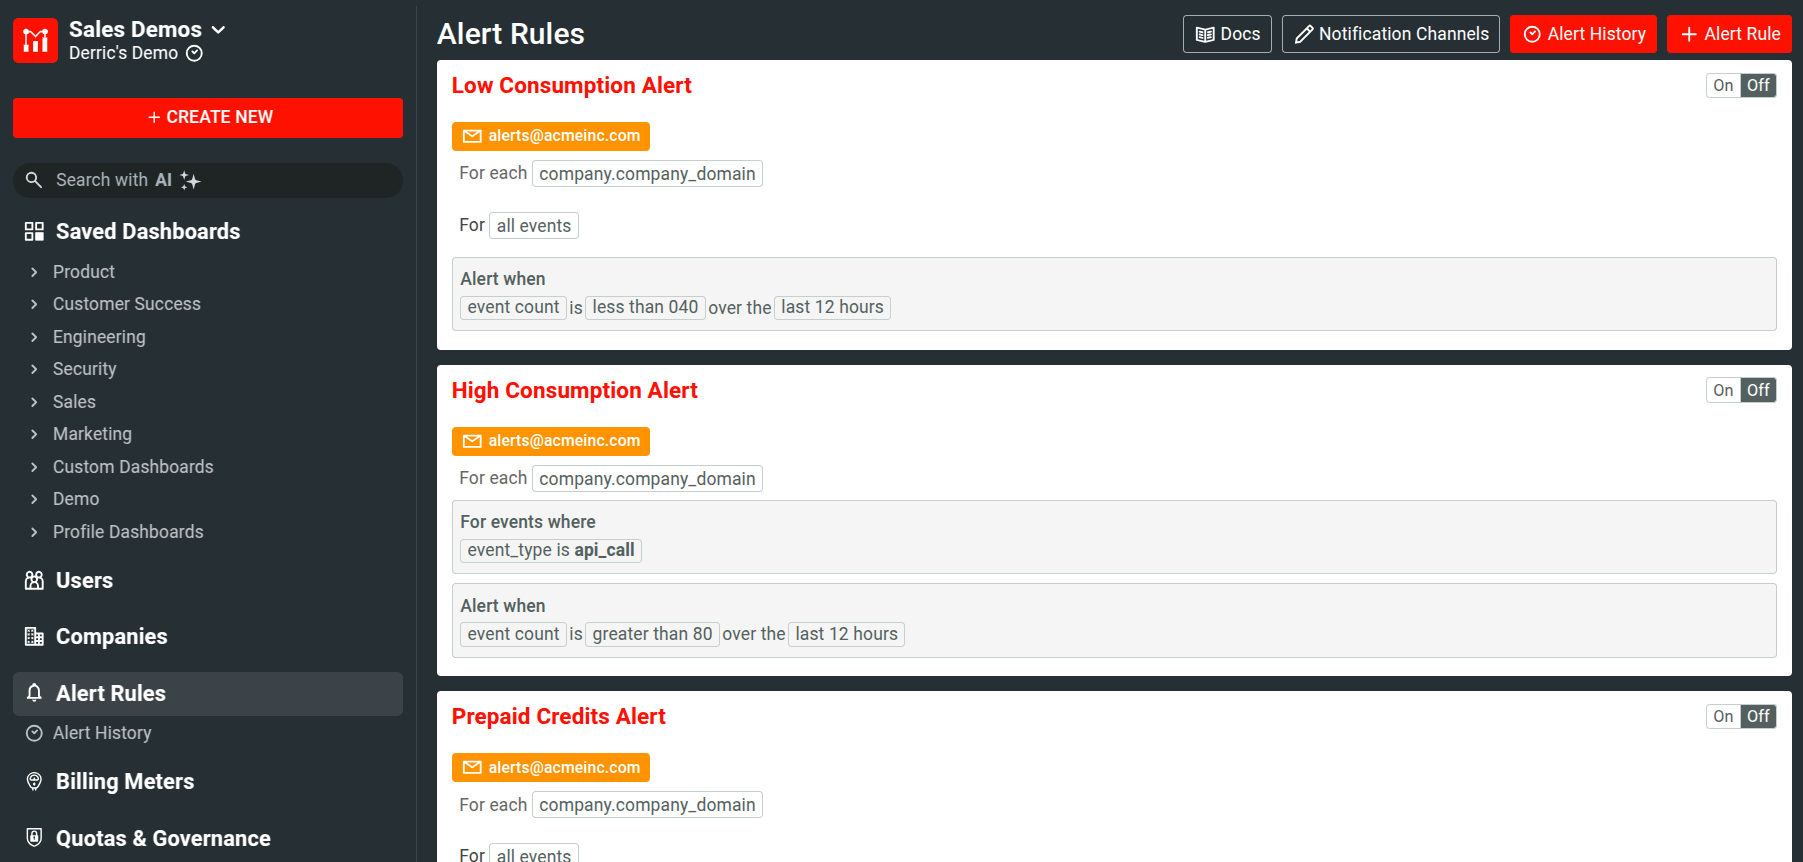
Once the alert rule is created, you can view it later under Alert Rules. Keep in mind that there are many error conditions which are more of a user error or bad experience, rather than a real error. For example, an API consumer may not fully understand how your API filtering and pagination works causing them to always get empty search results. In these cases, you should leverage body filters to set up alert rules that may imply a bad experience such as repeated responses with no results.
Inspecting API calls for API observability
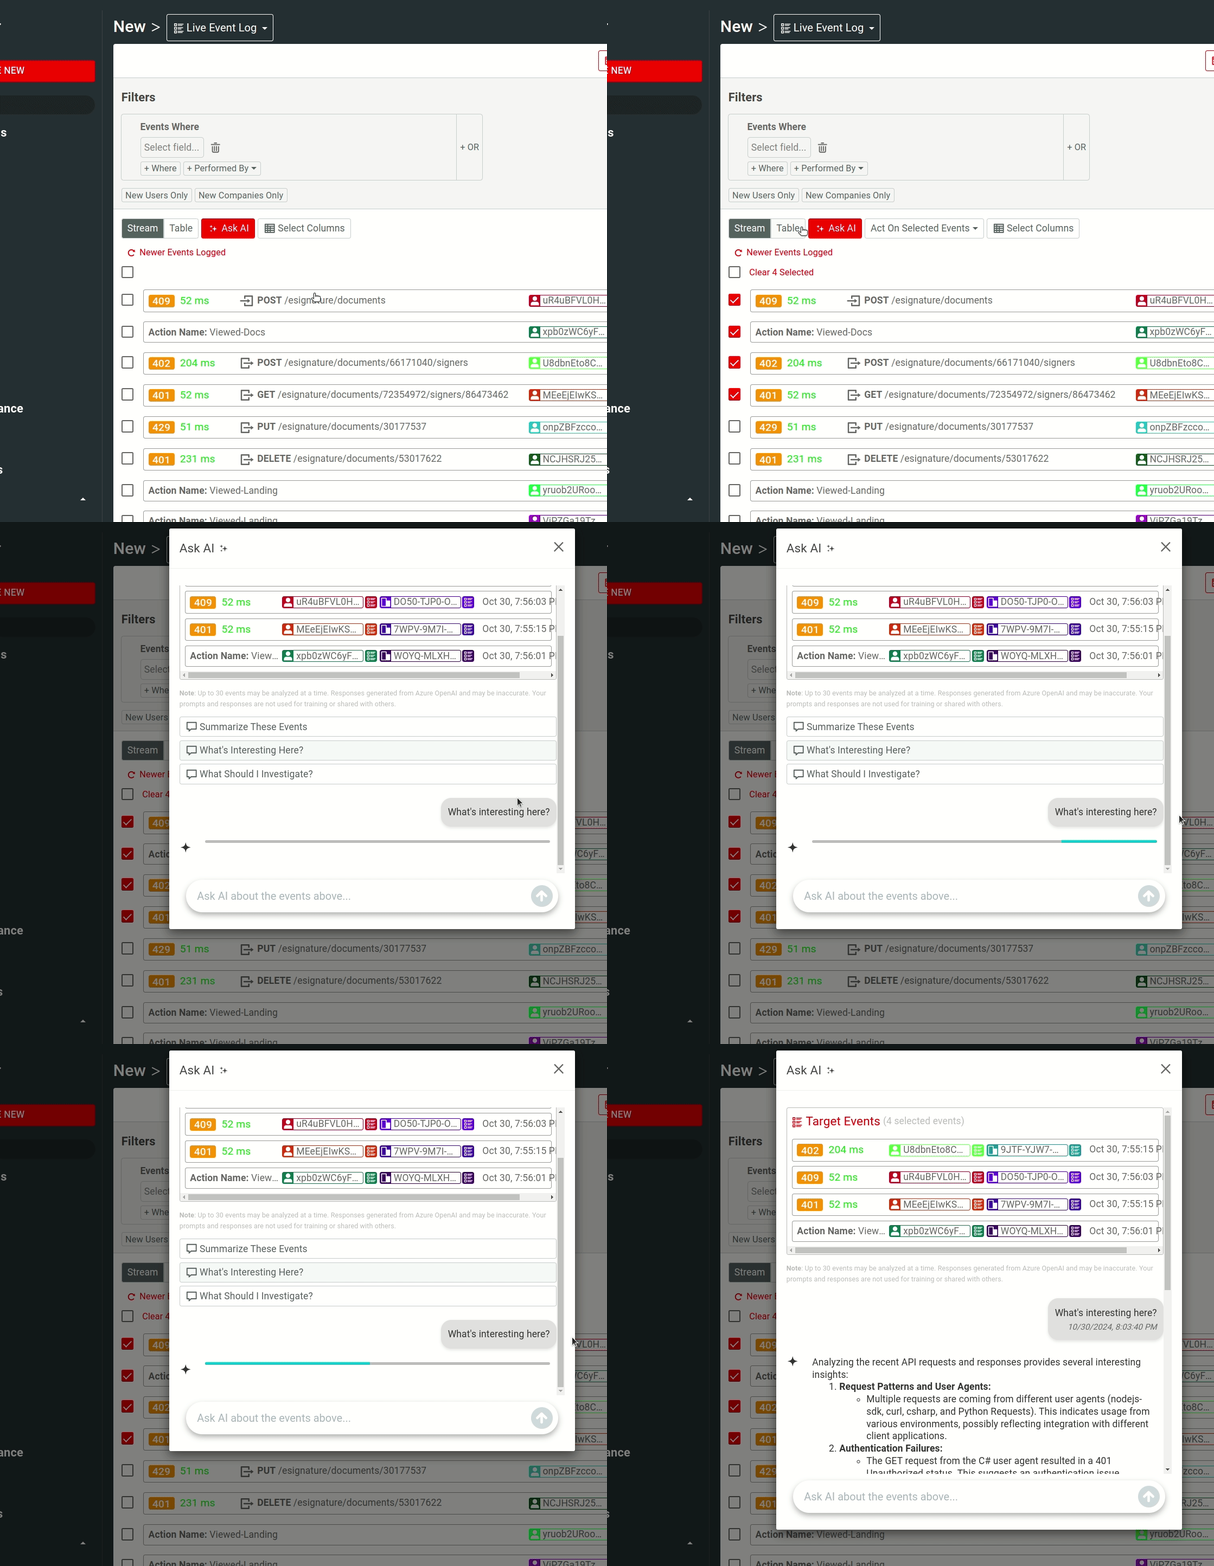
The live event stream shows API calls as they come into your Kong instances. Capturing and analyzing API requests is crucial to understand the flow of data and resolve potential problems before they impact end users. Unlike typical infrastructure metrics, API calls naturally have a large number of fields, with each field taking on a large number of distinct values. Analytics solutions like Moesif are designed for APIs and architected for high-cardinality, high-dimension analysis that’s expected of API traffic. This means you can filter and create complex aggregations by any of the HTTP headers or body fields which heavily reduces the time spent on manual search and SQL queries. You’ll also have the nice benefit of a unified view even for Kong instances that are in different data centers.
Debugging and Troubleshooting with Moesif
Moesif offers a suite of features that simplify the process of debugging and troubleshooting APIs. By analyzing performance data, developers can pinpoint issues and optimize their APIs for improved performance. Moesif’s API observability features provide deep insights into API traffic and behavior, making it easier to identify and resolve problems. With Moesif, developers can quickly identify and address issues, reducing the mean time to resolution (MTTR) and enhancing overall API performance. This comprehensive approach ensures that your APIs remain reliable, performant, and capable of meeting the demands of your users.
Product and Business Metrics
Engineering teams are not the only folks that need access to API metrics. Every part of your business should leverage visibility into customer API usage, whether product to sales to customer success. A modern API analytics solution like Moesif with Kong enables you to tie API calls back to individual users (or companies) and then enrich those users with demographic info. This enables you to maximize the business value of your APIs and Kong investment by understanding who is calling what. This is sometimes called API product analytics or API analytics.
Track API usage broken down by customer
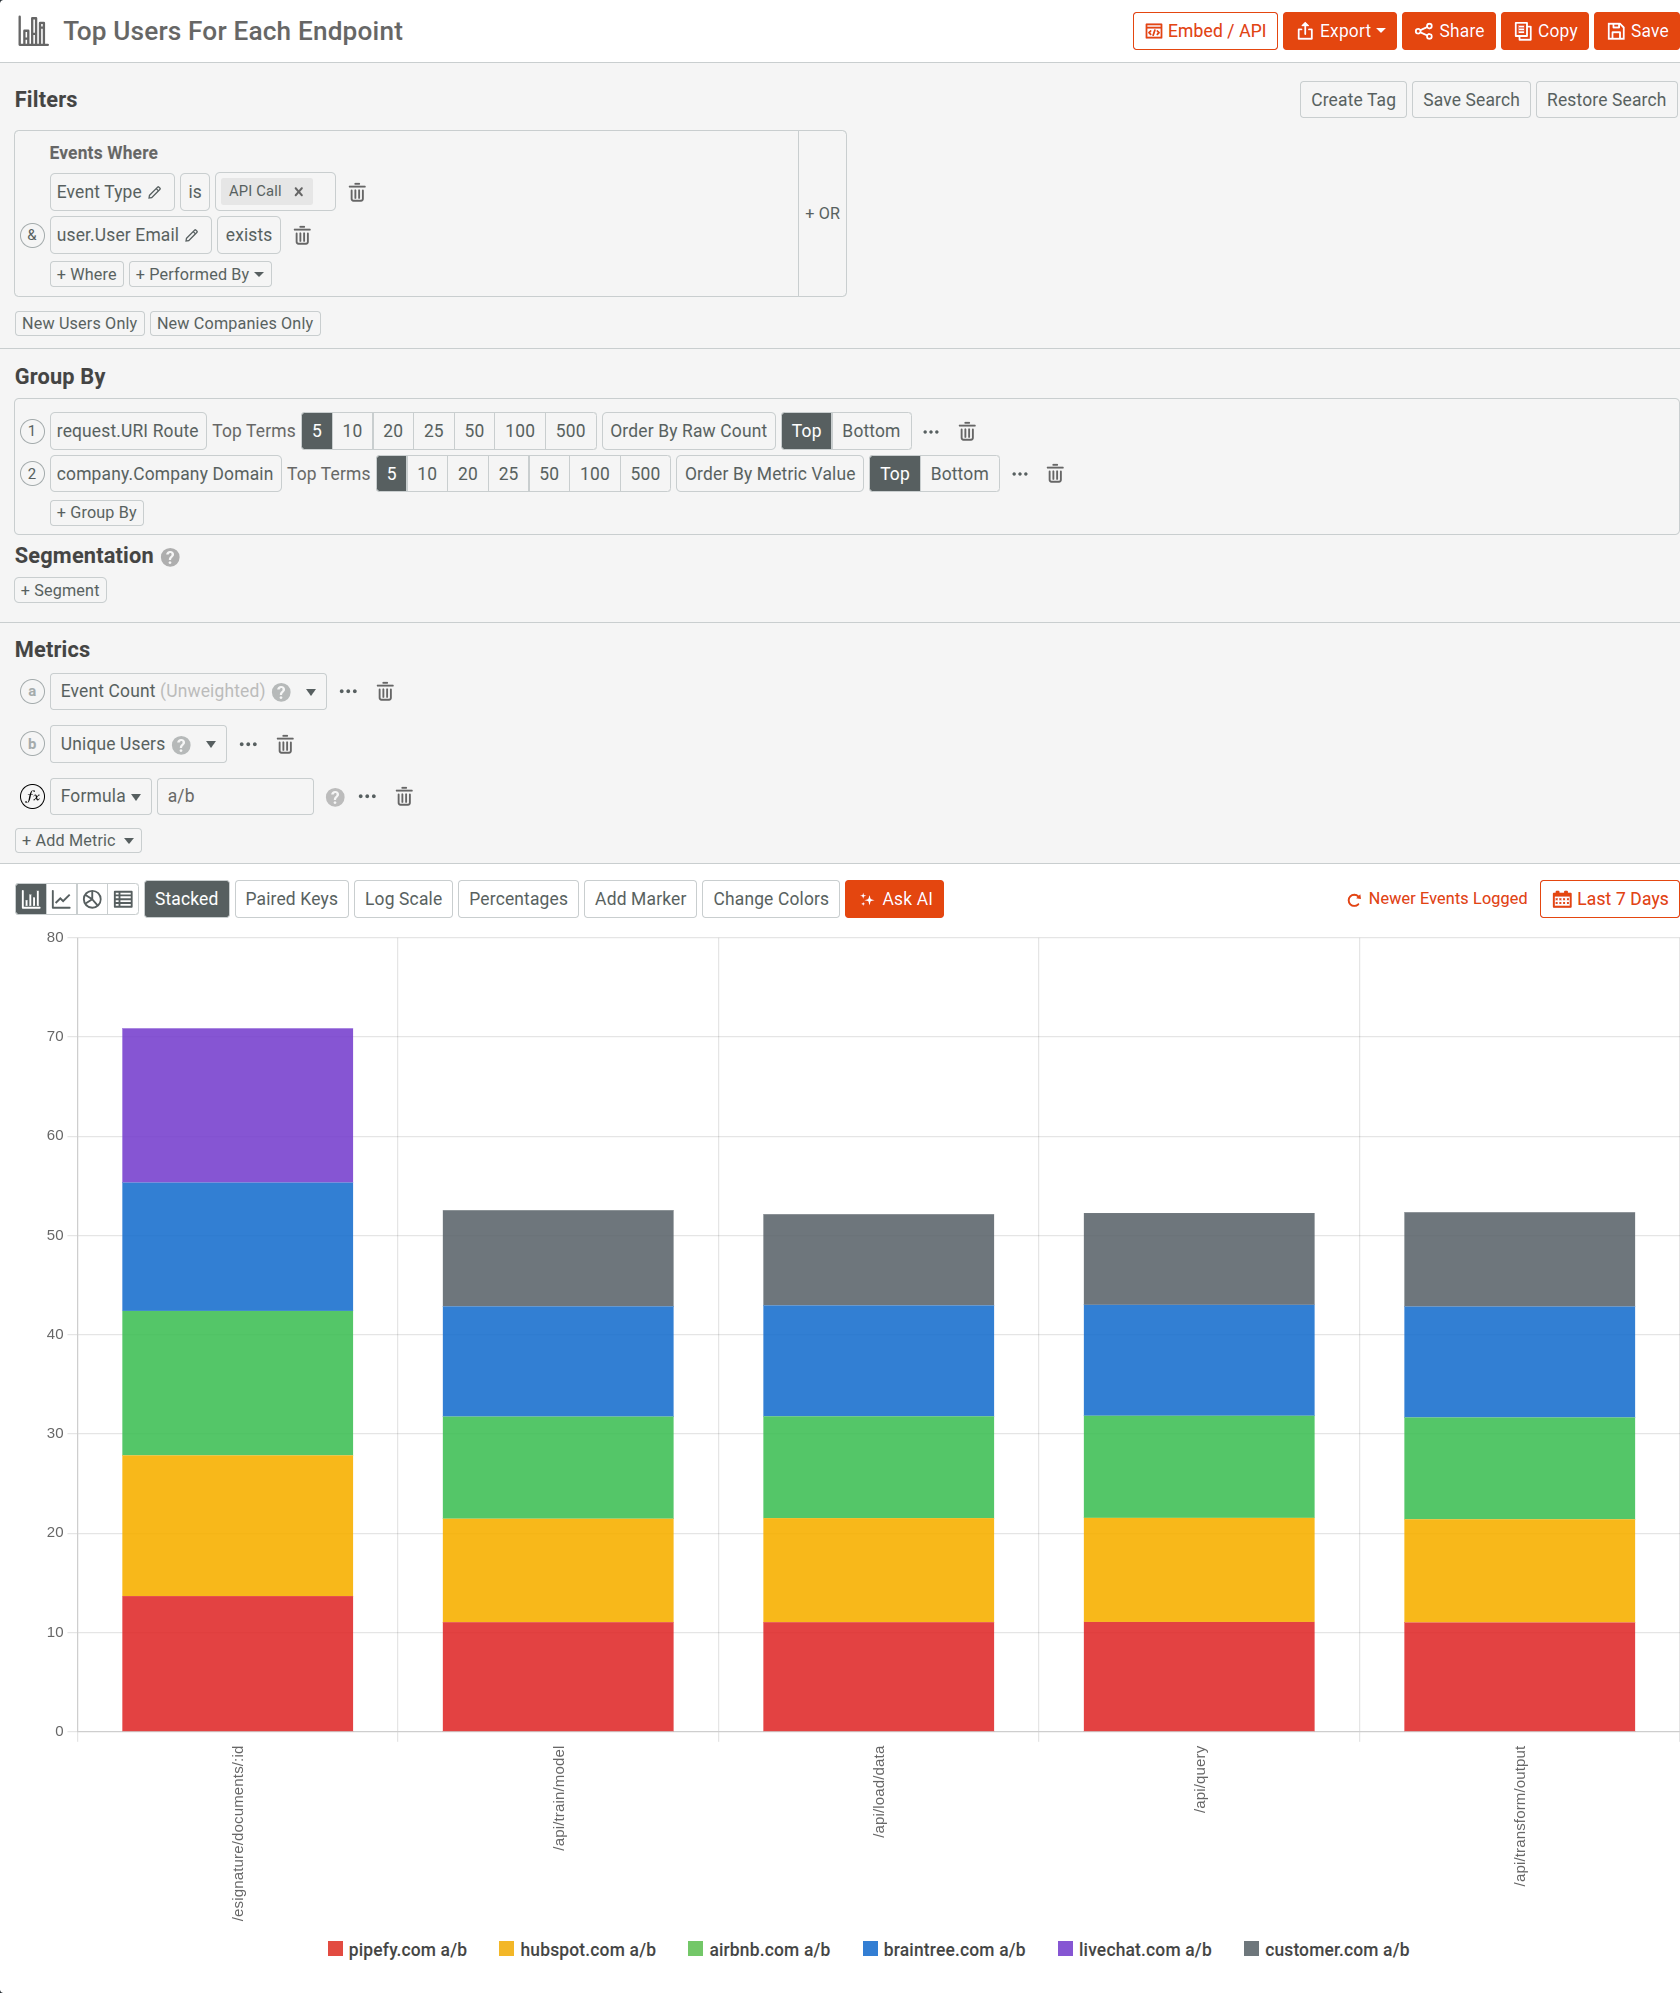
One of the first things any API-first team should be looking at is their distribution of API traffic. APIs being transactional by design are naturally a medium to transfer value, with each API call being a measurable unit of value. As an example, a location API may have their users pay dollars to extract location data. The more location queries (i.e. API calls) they perform, the more that user gains from using your API. If you’re charging your API consumers, hopefully they are paying the most. Companies like Twilio have leveraged this by charging their customers for each literal API call. 💰
Attributing API users to acquisition channels
Once you have a good understanding of who your top API users are, you should start looking at where they come from. If you’re treating your API as a product, then product marketing and growth teams will need to know where to invest more marketing dollars. To track this, you should also install the Moesif browser SDK which automatically collects web behavior and attribution info and will tie it back to your Kong metrics. The Moesif Kong integration will automatically track unique users based on the Kong consumer id and the consumer username.
Understand your adoption funnel
Without showing adoption, most API programs will not be able to get the resources they need to continue. A great API should have a great adoption and growth story that’s efficient and effective. Yet, APIs are an incredible hard sell. Most developers are not responsive to outbound sales and paid marketing, yet APIs have a high barrier to adoption as a developer needs to integrate it. This means you should track your adoption funnel religiously. There are two key metrics Moesif recommends tracking:
Time to First Hello World
Also called Time to First API Call, Time to First Hello World (TTFHW) is the golden metric API-first companies track against. Time to First Hello World is the time it takes for a new developer to sign up and make their first API call enabling them to get at least some value from your API. From a business standpoint, some may call this time to value. Before their first API call, your developer consumers got very little from your API program and it can feel magical for those developers who do get to making their first API call.
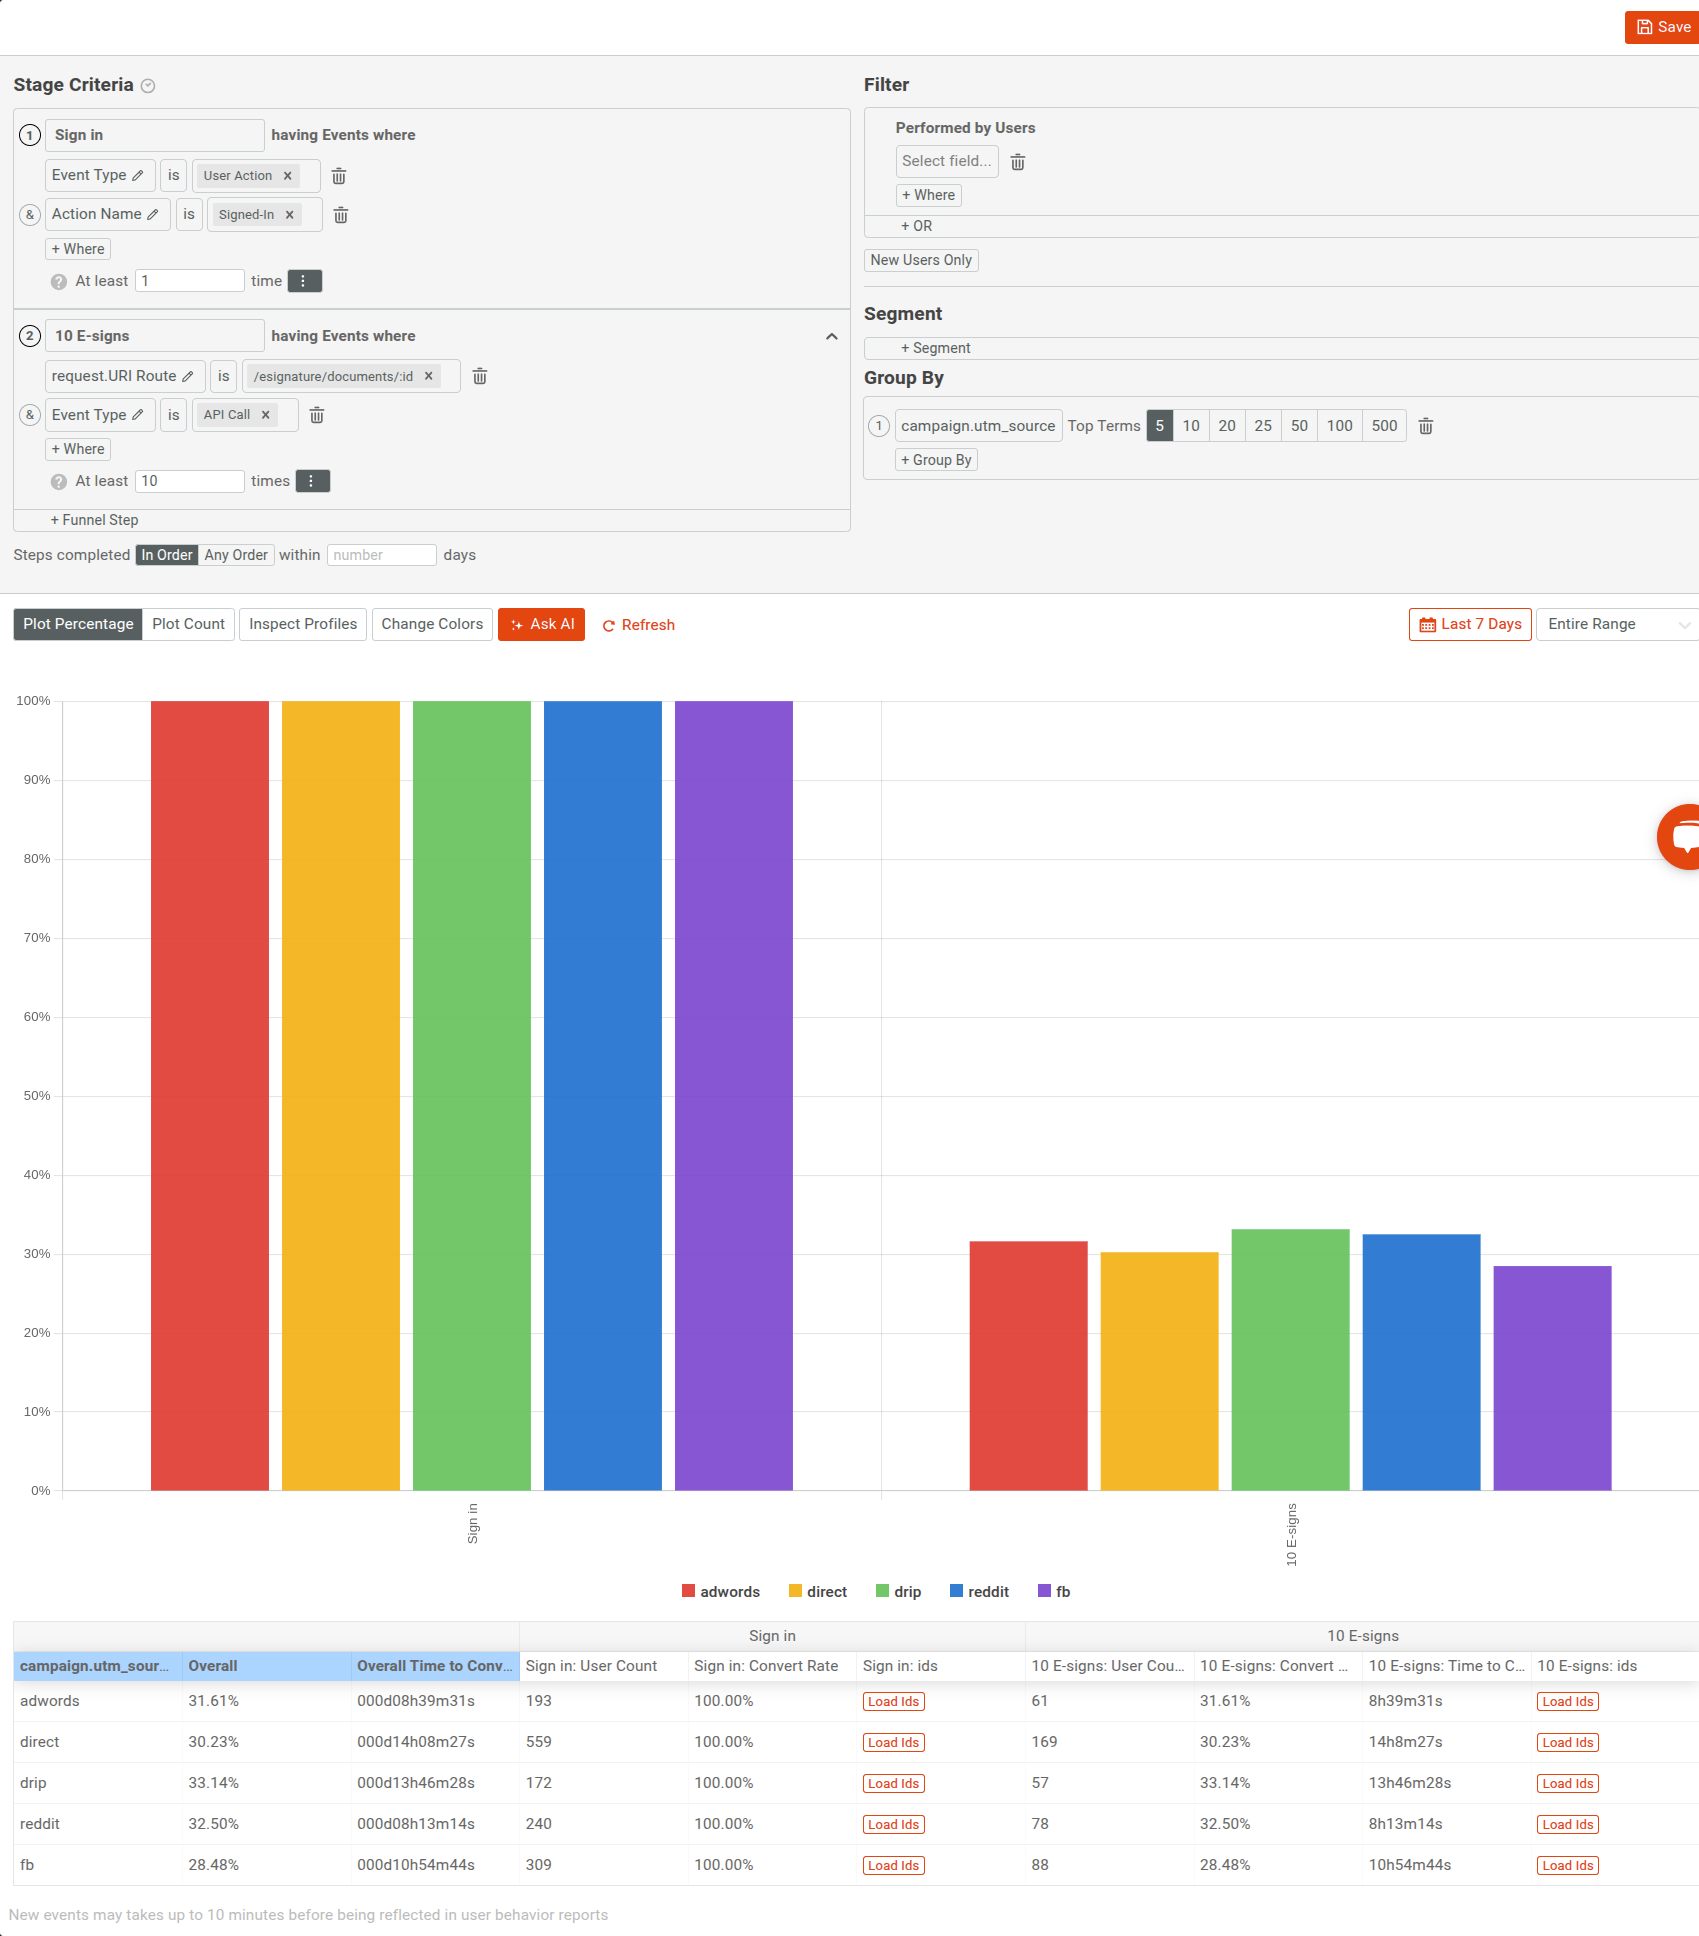
TTFHW is not the only metric you should be looking at, there is a second which is Time to First Working app, or sometimes Time to First Paid App. This definition varies by product and API, but closely resembles an active user. In the above chart, we are showing both the time from their first step to their first Hello World which looks to be 6 hours and 5 minutes. Then, we can track the time from their Hello World to their working app which we define as over 100 API calls to /api/:id/payment
Conversion rate
Just like we can track the time to convert, we should also be tracking the conversion rate itself. A higher conversion rate would naturally correspond to higher revenue. Similar to us tracking TTFHW, you should be tracking the conversion rate at each step in your customer journey. Then you can break this down by demographics like we did earlier such as by acquisition channel.
Closing thoughts
Having the right instrumentation in place to monitor Kong is critical not only to understand performance, but also gain business visibility into API adoption and usage. With the Kong integration, this metrics collection is handled automatically and at scale. This enables you to build a better API product strategy and support your customer better.
 See how Kong and Moesif work together to provide API metrics
14 day free trial. No credit card required.
Learn More


