How to Track the Usage of AI APIs: The Ultimate Guide
When it comes to exposing artificial intelligence (AI) services, APIs (Application Programming Interfaces) have become the building blocks for integrating AI capabilities into software and applications. These APIs provide access to various AI models, from natural language processing to image recognition, opening up many possibilities for developers and businesses.
However, with the growing adoption of AI APIs comes the need to track usage effectively. Whether you’re an AI provider managing API access for customers or a developer integrating AI into your projects, understanding how your APIs are utilized is crucial.
In this guide, we’ll explore tracking your AI API usage, explain its relevance, and provide you with how to leverage Moesif’s API analytics capabilities to gain deep insights into your API traffic. By the end of our guide, you’ll have the knowledge and tools to monitor, analyze, and optimize your AI API usage effectively.

What is an AI API?
Before we get into tracking AI API use, let’s simplify the term “AI API”. An AI API is a software interface that lets you interact with pre-trained AI models. These models have been “taught” to perform various forms of content, such as language translation, sentiment analysis, or creative content generation.
When you use an AI API, you send it input (like a sentence you want to be translated or an image you want to be analyzed), and the API processes it using the underlying AI model. It then returns the output (the translated text, the identified objects in the image, etc.). This all happens smoothly and hides the detailed formulas happening in the background.
AI APIs have become popular because they allow developers to add advanced AI capabilities to their applications without building and training their own models from scratch. This saves time and resources and opens AI to a wider range of users. Many companies are now exposing their AI capabilities to the world through AI APIs.
Why Track the Usage of AI APIs?
Tracking the use of AI APIs allows you to uncover dominant trends that drive your AI initiatives forward. Here are some reasons why tracking is essential:
- Cost Management: AI APIs often operate on a pay-per-use model. Tracking usage helps you understand your spending patterns, identify potential cost optimizations, and budget more effectively.
- Performance Monitoring: By monitoring your API response times, error rates, and latency, you can ensure that your AI-powered applications are running smoothly and delivering a positive user experience.
- Security and Anomaly Detection: Usage tracking can help you identify unusual activity patterns and indicate potential security breaches.
- User Behavior Analysis: Understanding how users interact with your AI-powered features allows you to tailor your offerings, boost user interaction, and prioritize future development efforts.
- Business Intelligence: Usage data can provide valuable information for making data-driven decisions, identifying your most popular AI features, understanding peak usage times, or measuring the ROI of your AI investments.
- Billing and Usage-Based Pricing: If you’re an AI provider, accurate usage tracking ensures fair and open billing for your customers.
- Debugging and Troubleshooting: In case of errors or issues, having detailed logs of API requests and responses can assist with diagnosing and resolving problems.
Tracking your AI API usage enables you to make informed decisions, optimize your resources, enhance security, and ultimately deliver more value to your users and customers.
What Should You Be Tracking?
Now that we understand the “why” behind tracking, let’s explore the “what.” Here are the metrics that you should be monitoring to gain a deeper understanding of your AI API usage:
- API Call Volume:
- The total number of API requests made over a given period.
- Monitor for spikes, trends, and anomalies to identify peak usage times and potential bottlenecks.
- Token Usage (for Language Models):
- The number of input and output tokens processed by the API.
- This is essential for cost management, as many AI providers charge based on token usage.
- Unique Users/Companies:
- The number of distinct users or companies accessing your API.
- This helps you understand your customer base and identify your most active users.
By tracking these key metrics, you’ll understand all aspects of your AI API usage, enabling you to make informed decisions, optimize your performance, and power the success of your AI projects.
How to Track AI API Usage with Moesif
Moesif is a comprehensive API analytics platform that gives you deep insights into your API traffic, including your user’s AI API usage. Here’s how you can leverage Moesif for effective tracking:
- Track Usage by API Call Volume:
- Moesif automatically captures every API call to your AI endpoints.
- You can view detailed logs of these calls, including timestamps, request/response payloads, status codes, and response times.
- Analyze trends in API call volume, identify the most frequently used endpoints, and detect anomalies or sudden usage spikes.
- Track Usage by Input/Output Token:
- Large Language Models (LLMs) like GPT-4 and Gemini often measure their usage in tokens (pieces of words). Moesif can track the number of input and output tokens for each API call.
- This is essential for understanding your user’s token consumption and optimizing your pricing and infrastructure costs.
- Track Usage by Unique User or Company:
- Moesif can associate API calls with specific users or companies, allowing you to monitor usage on a deeper level, identify your most active users, and understand usage patterns across different customer segments.
- This can provide crucial insights into how your user base is growing and if your marketing, sales, and onboarding processes are effective.
As a next step, let’s dive deeper into each of these tracking methods and how to explore these metrics in Moesif.
Track Usage by API Call Volume
First, we will use a Time Series chart in Moesif to analyze our usage by API call volume. To open up a new Time Series chart, from the Moesif dashboard, click the + New button in the top left of the screen and select Time Series.
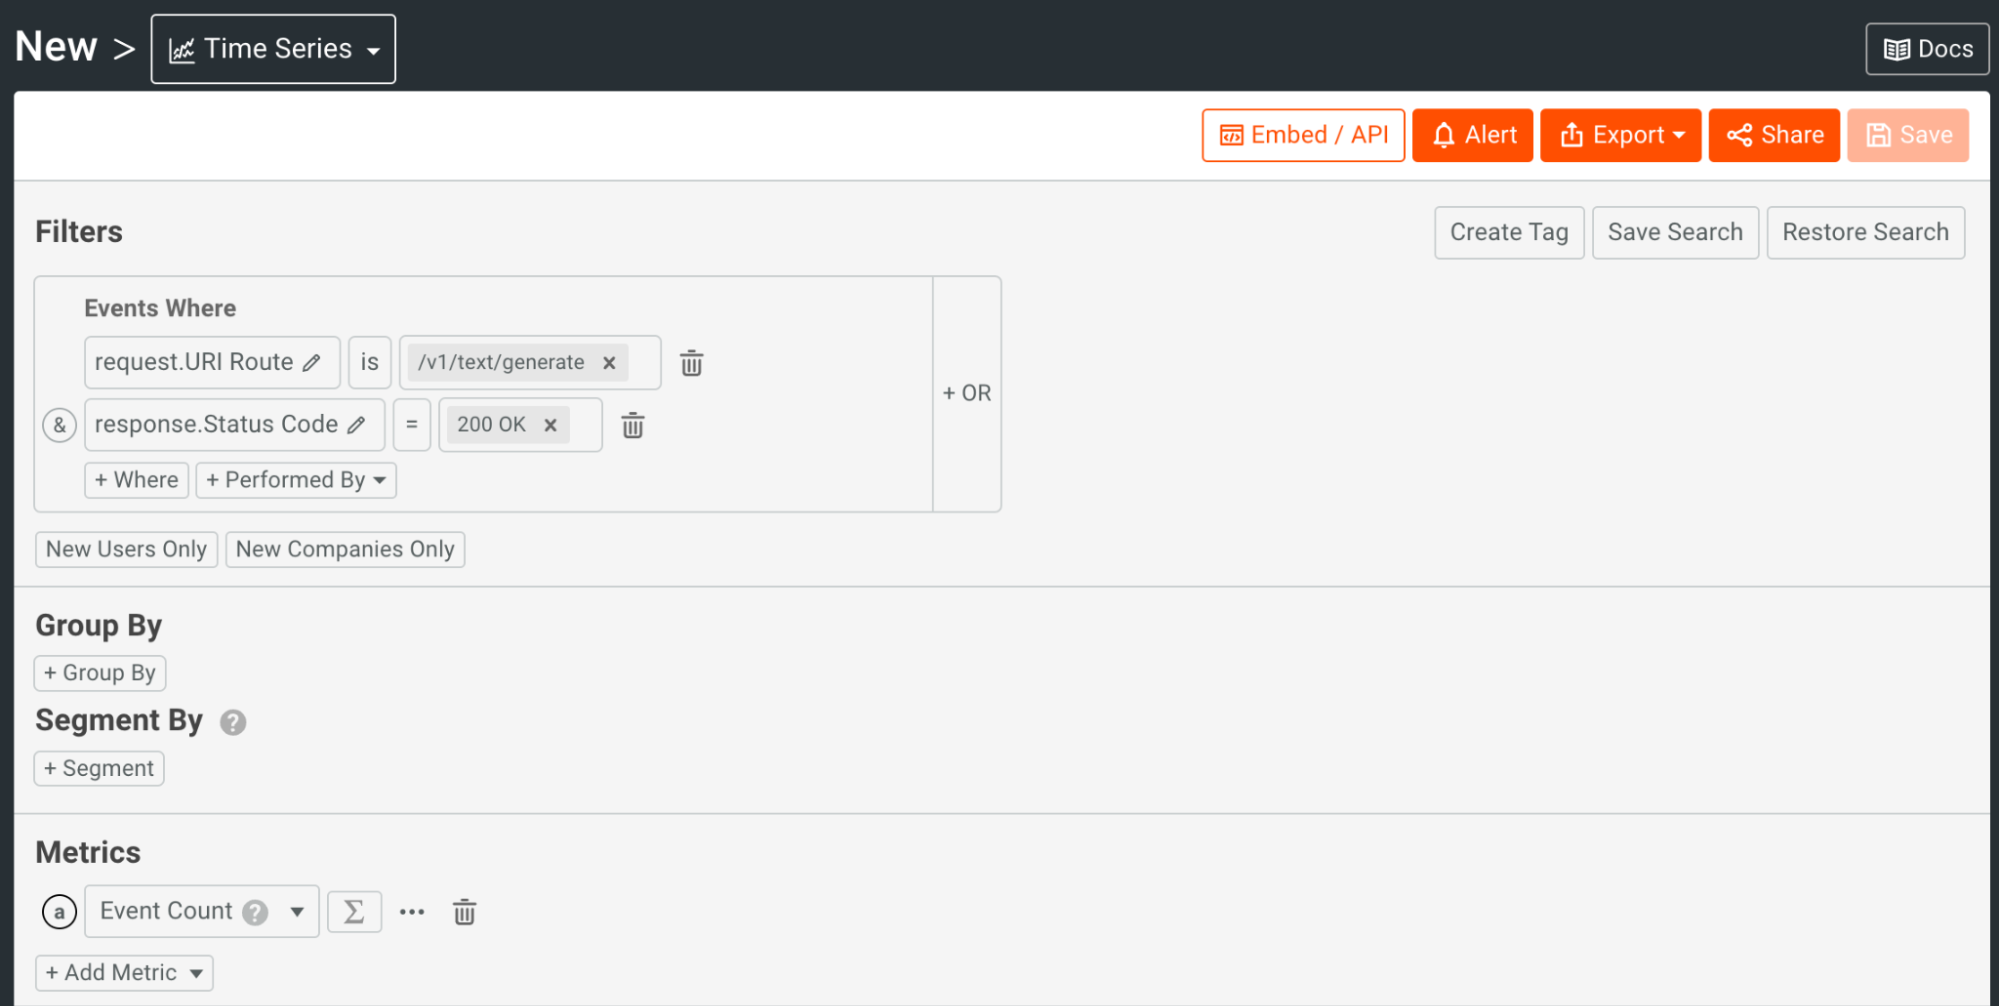
To configure the Time Series chart, we will need to dial in the Filter and Metrics sections. First, add a filter for the particular AI API route(s) you want to explore and potentially add additional criteria to the filter, such as HTTP Verb/Method, Response Status Code, etc.
Once your Filter is set, set the Metrics dropdown to Event Count. This means that the metric displayed on the chart will be the API call volume or overall event count. Here’s an example of what that may look like:
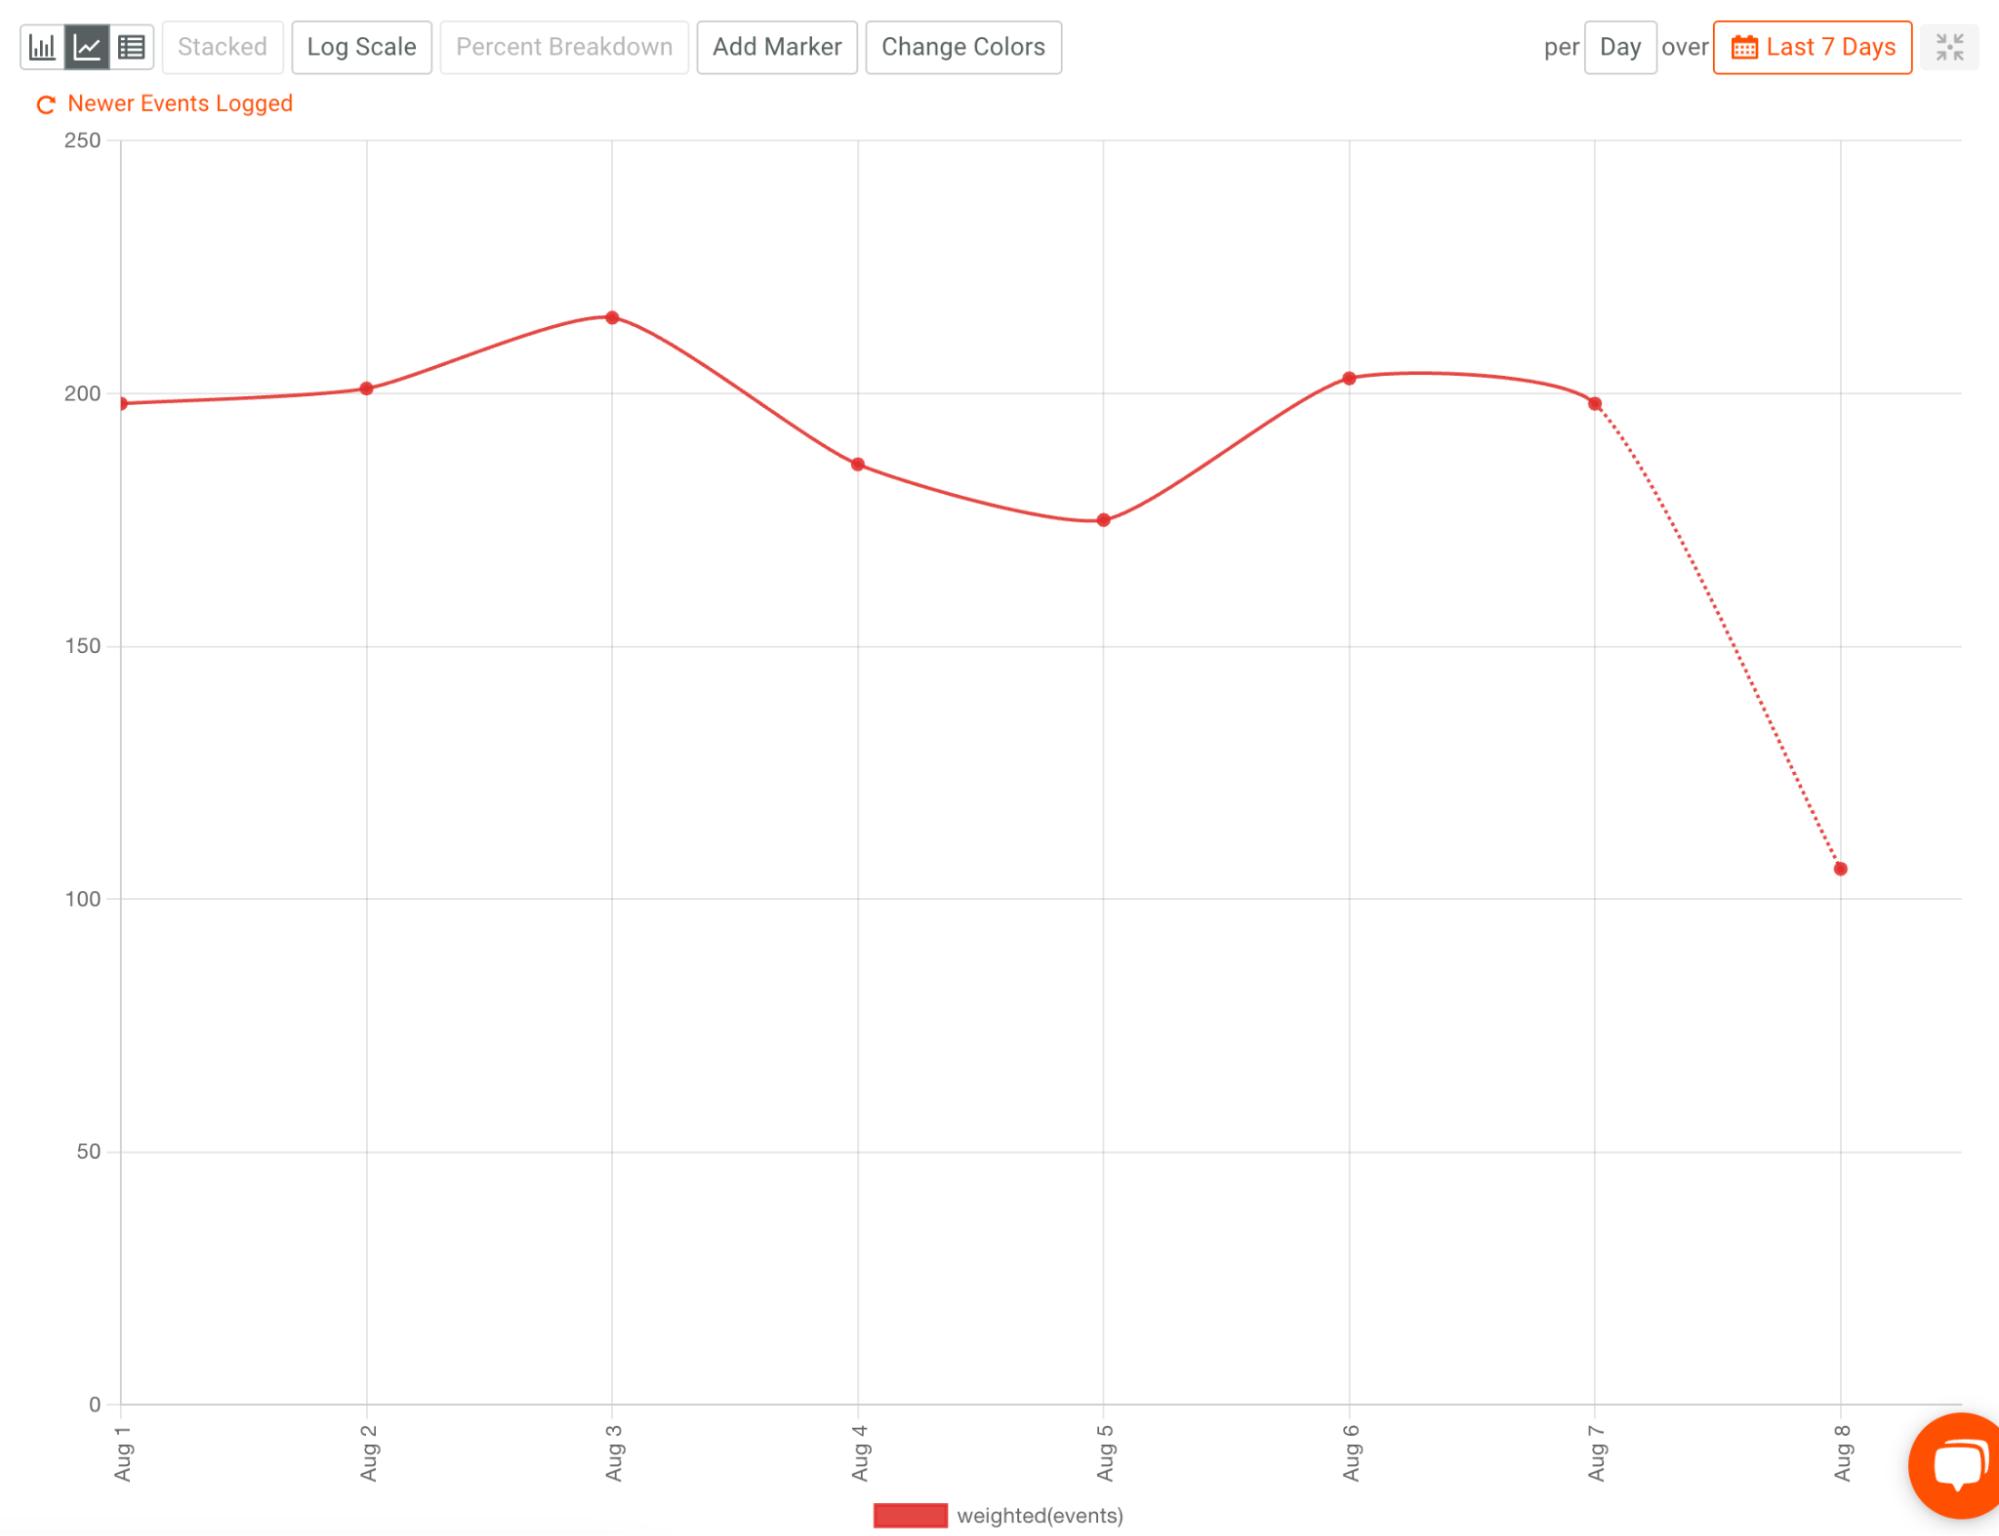
Once our chart criteria are complete, we can see the resulting chart as a line graph. This will allow us to visually understand the trends in our user’s AI API usage.
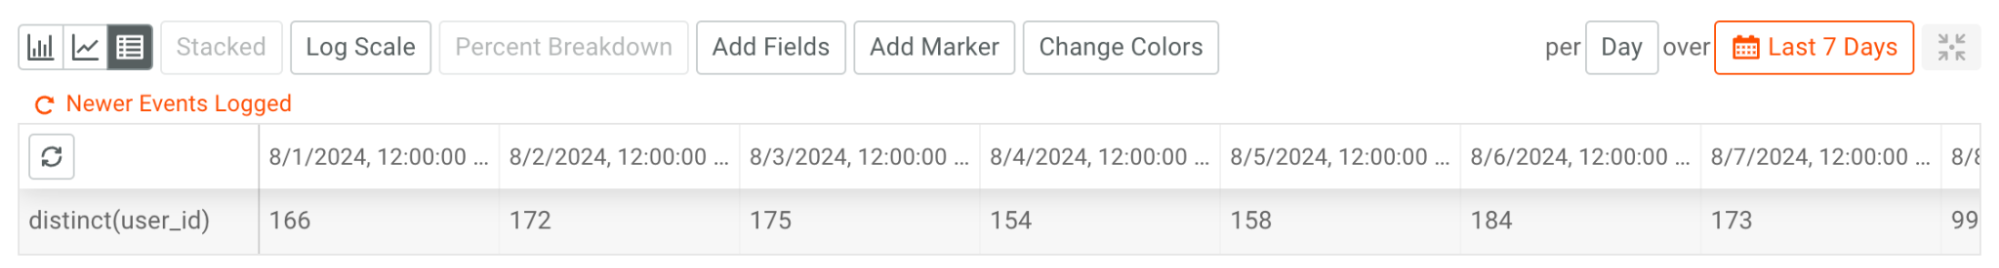
Alternatively, if you’re looking for an easier way to check out the exact numbers, you may want to look at the results as a table, which you can do by selecting the Table View selector in the top-left corner of the chart pane. Here’s an example of the data above shown as a table instead.
Track Usage by Unique Users or Companies
Just like viewing our usage data by API call volume, we will again use a Time Series chart in Moesif by clicking the + New button in the top left of the screen to analyze our usage by unique user or company.
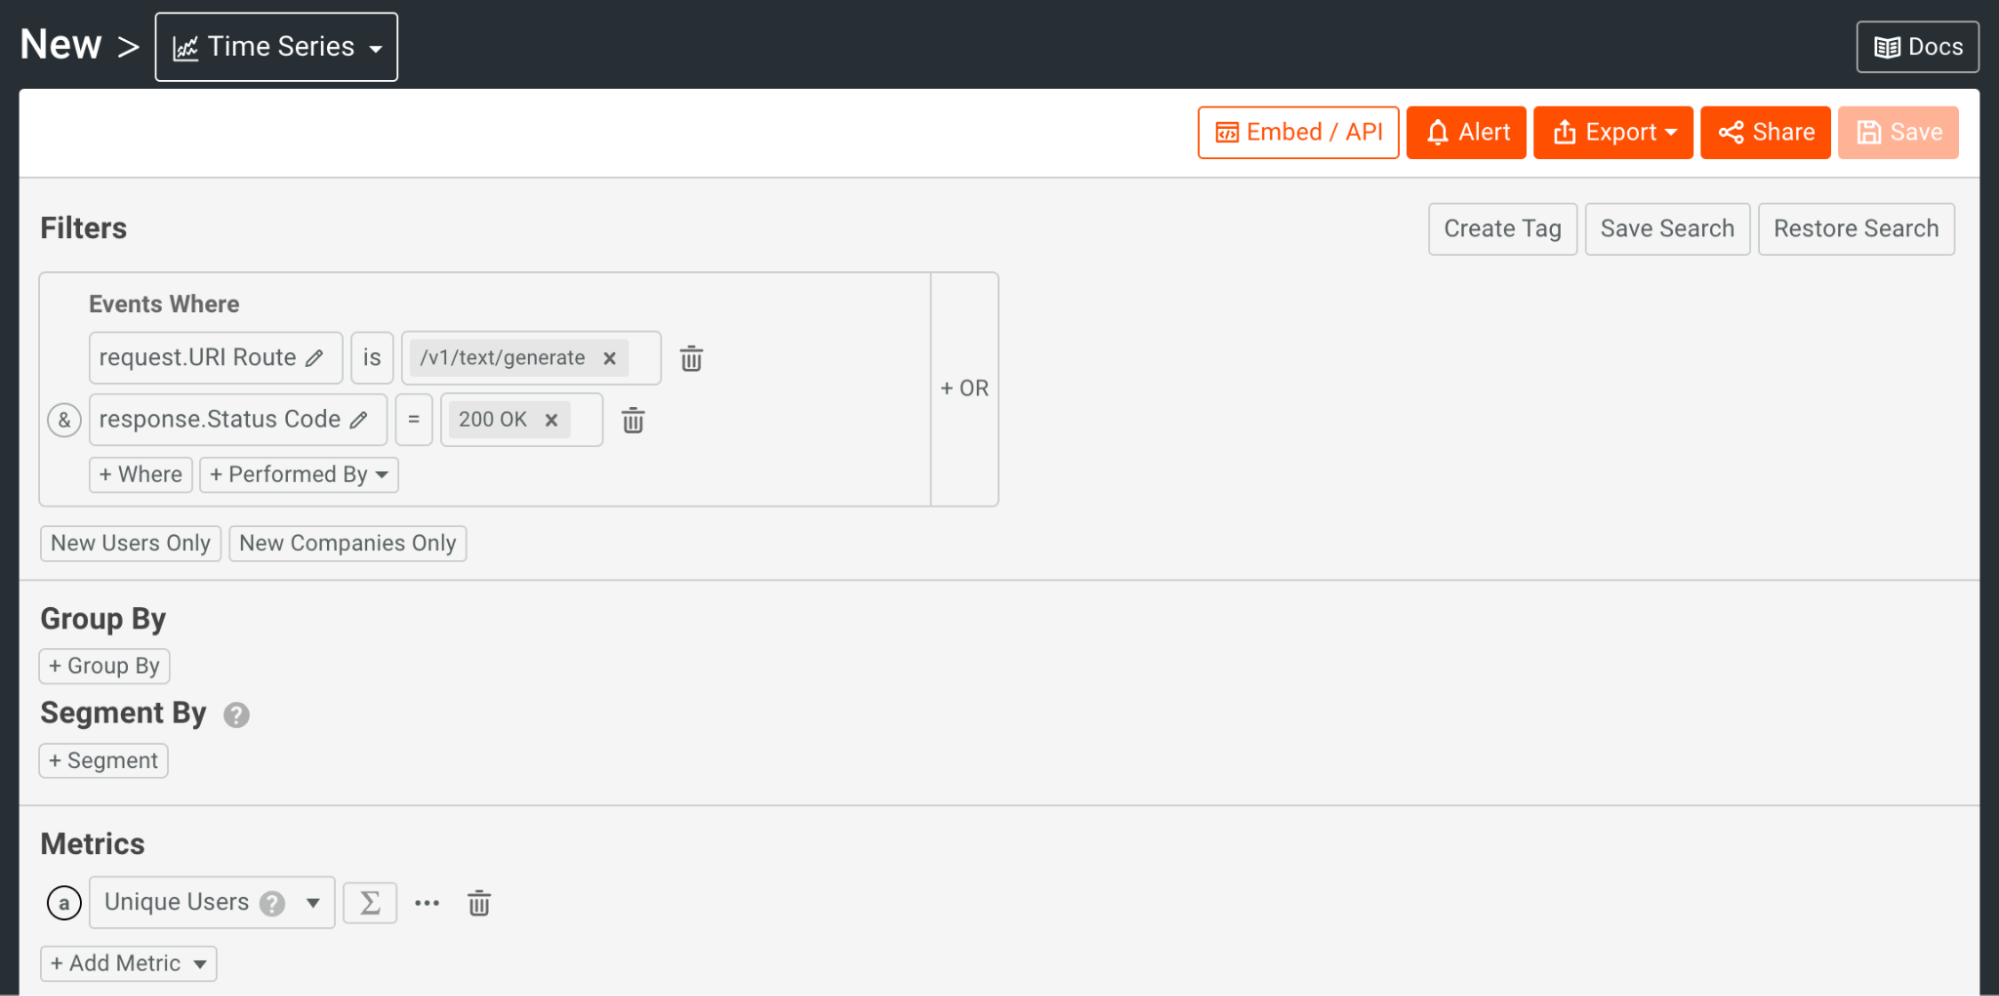
Again, we will add a Filter for the particular AI API route(s) we want to explore and potentially add additional criteria to the Filter, such as HTTP Verb/Method, Response Status Code, etc. Once your Filter is set, we will set the Metrics dropdown to either Uniques > Unique Users or Uniques > Unique Companies, depending on which metric we want to view. This means that the metric displayed on the chart will be the total number of unique users or companies accessing our API within the set time period. Here’s an example of what that may look like:
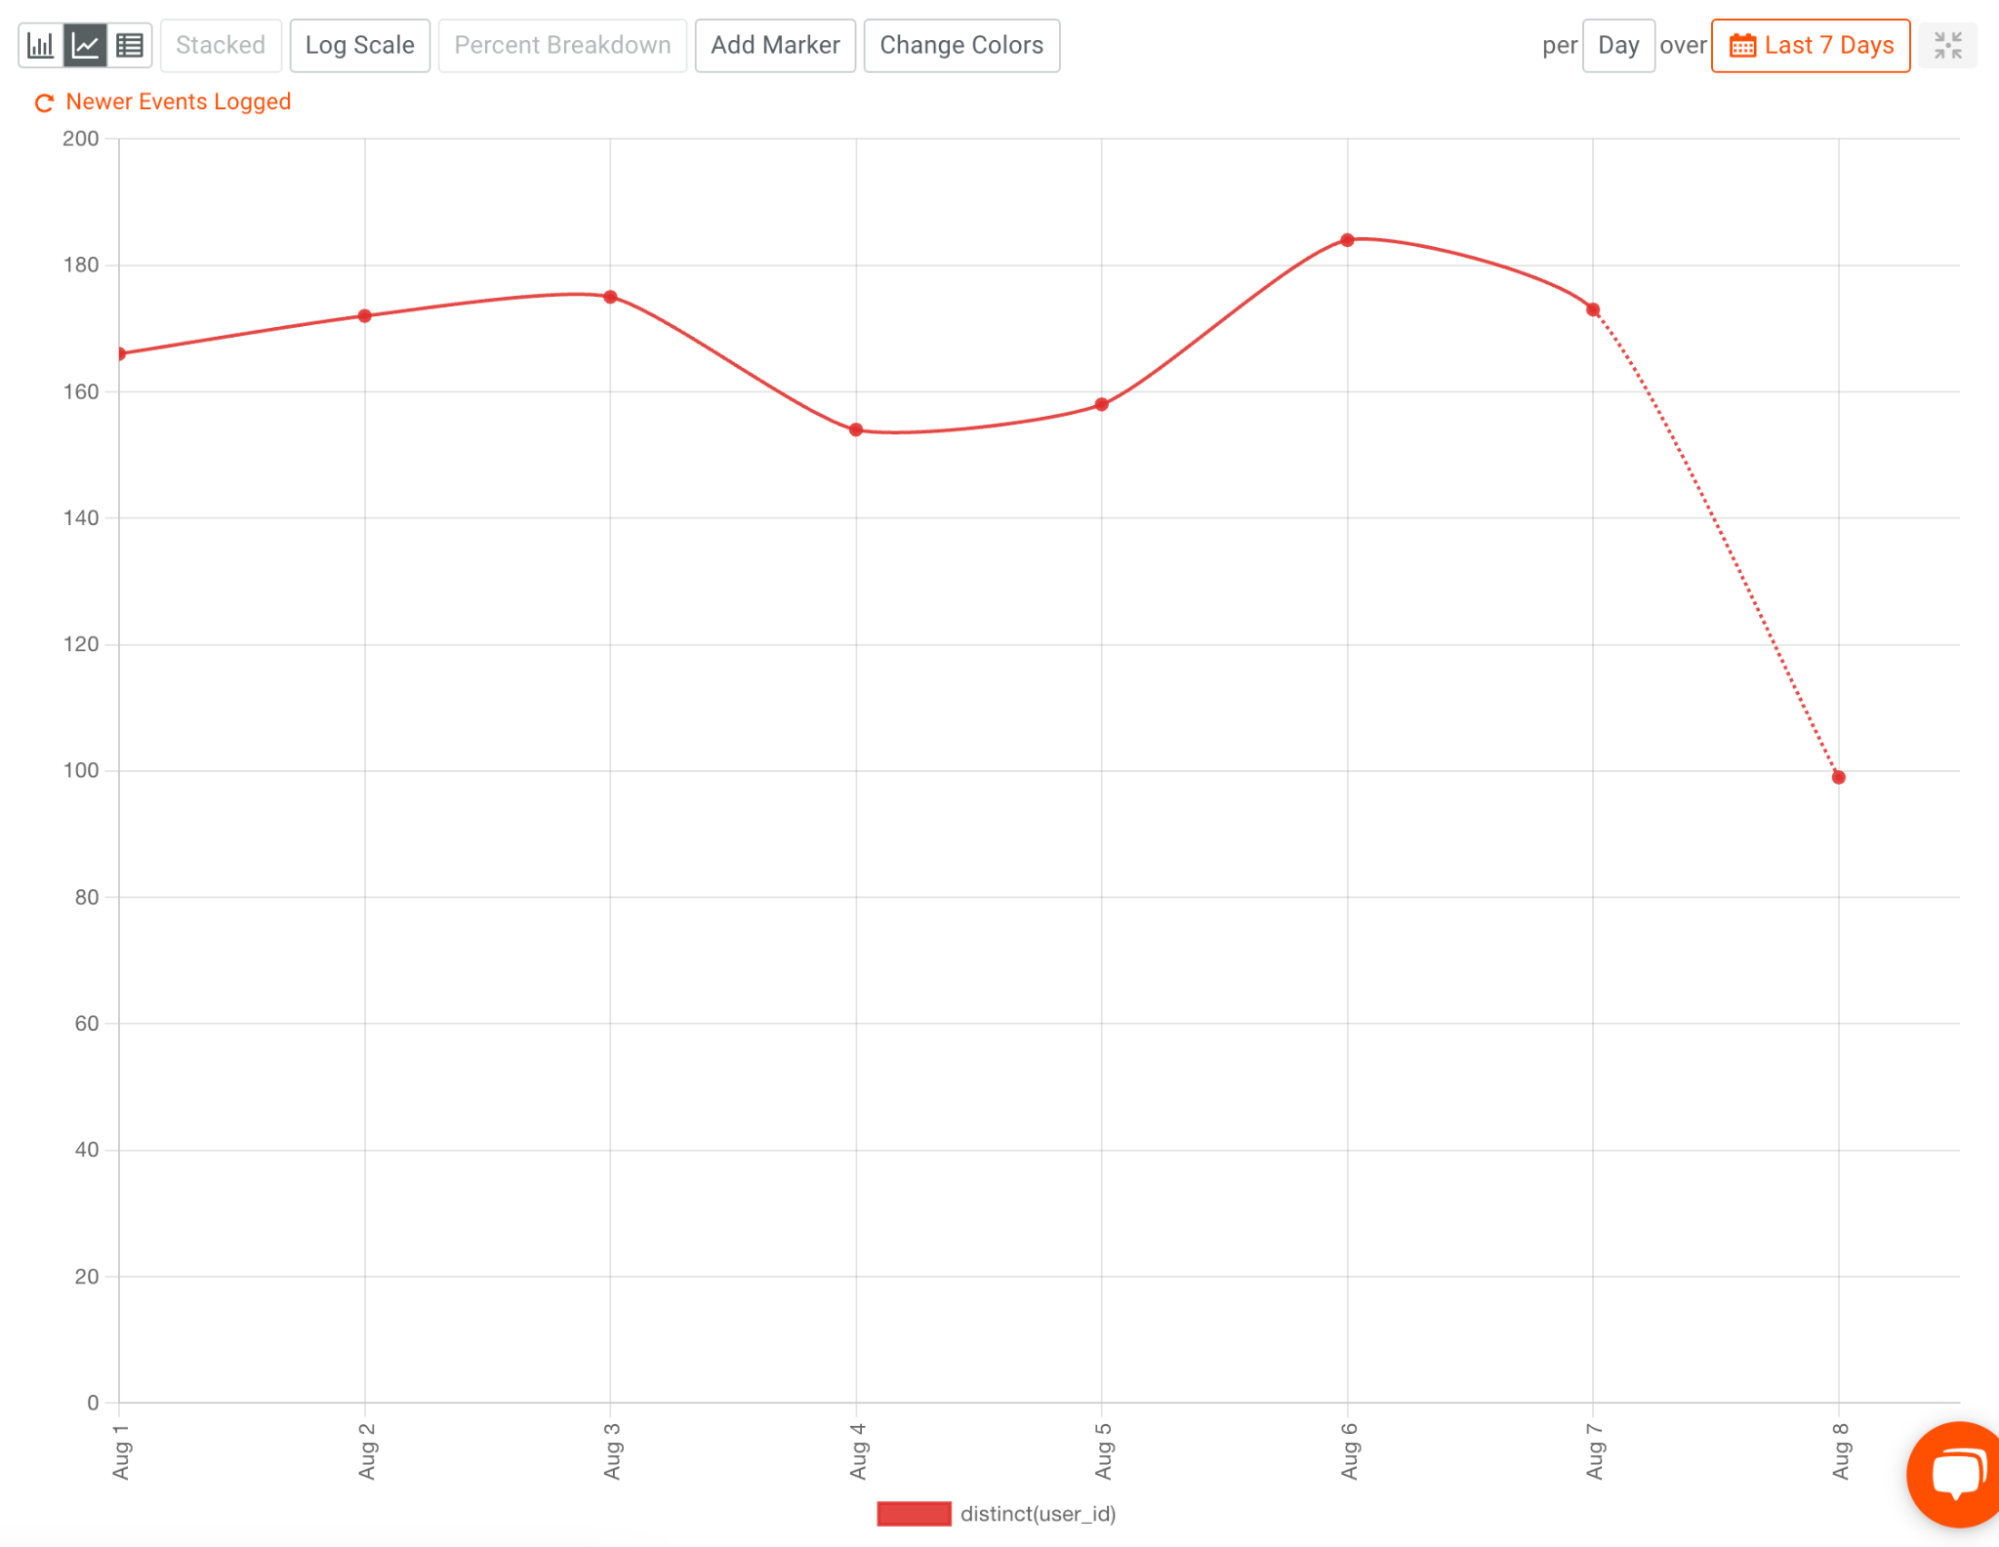
Once our chart criteria are complete, we can see the results in a line graph showing the number of unique users or companies accessing the API. This will allow us to understand trends in AI API usage visually. The chart below shows the number of unique users per day over the last seven days.
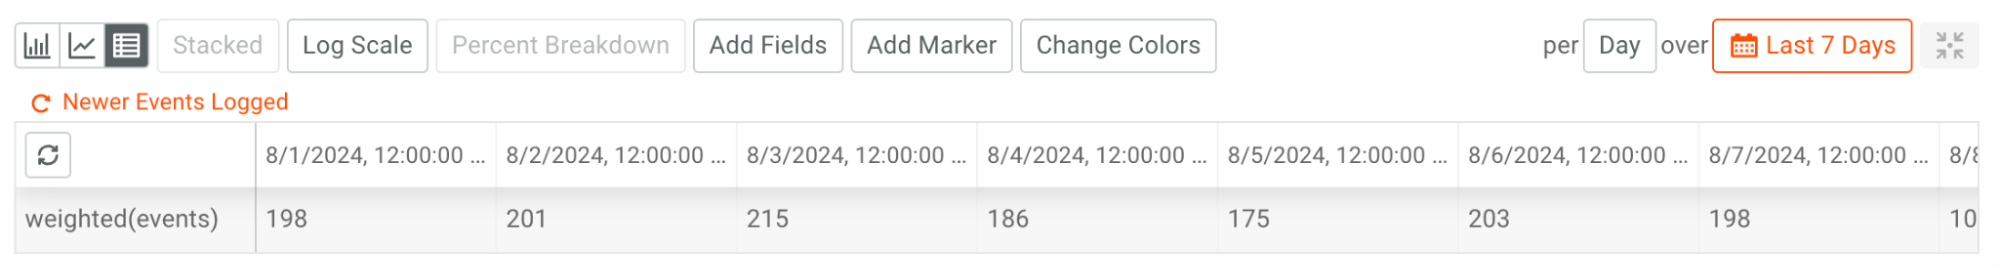
By selecting Table View, we can view this same data as a table, which can be easier to view if you want to see the exact numbers more easily.
Track Usage by Input/Output Token
Just like viewing our other example, to analyze our usage by input and output tokens, we will again use a Time Series chart in Moesif by clicking the + New button in the top left of the screen.
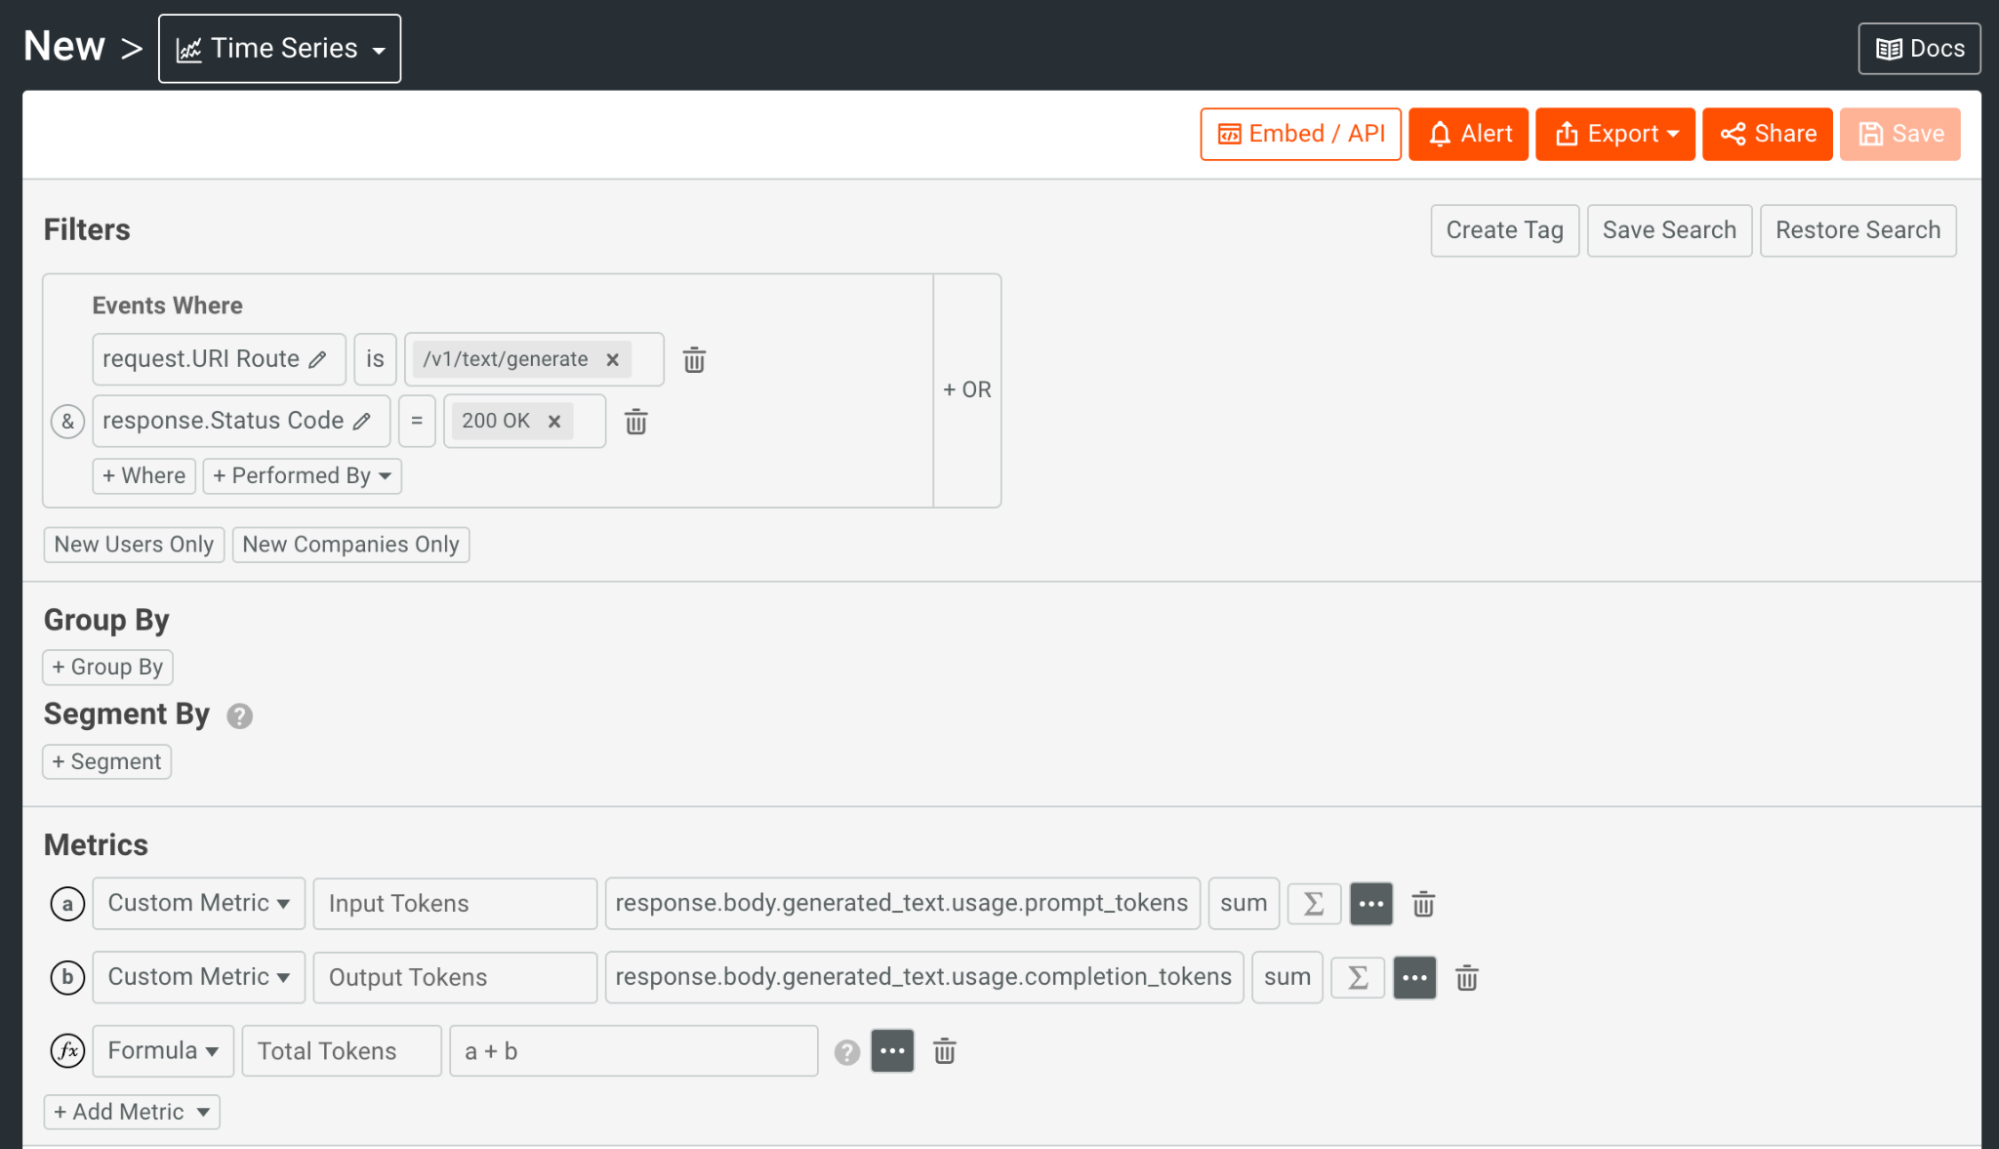
This time, we will add a Filter for the particular AI API route(s) we want to explore and potentially add additional criteria to the Filter, such as HTTP Verb/Method, Response Status Code, etc. Unlike previous charts, this chart will contain three metrics: one for Input Tokens, one for Output Tokens, and one for Total Tokens. We will click the Metrics dropdown and select the Select Field… option to add our metrics. From here, we will:
- Select the element of the API response that represents the input tokens consumed. This will be the response.body.generated_text.usage in the case below.prompt_tokens field.
- Set the field’s aggregation to “sum”. This will aggregate the usage and sum up the total usage across all API calls.
- Click the Add Metric button.
- Like input tokens, select the field in your API response denoting the output tokens used and set the aggregation to “ sum”.
- Click the Add Metric button again and select Enter Formula… from the options.
- In the Formula field, add “a + b”. This will take metric “a” (our input tokens), add it to metric “b” (our output tokens) and total them up.
- Optionally, you can add a custom name to each metric by clicking the ellipsis and checking off Custom Name.
Here’s an example of what that may look like, including a Custom Name for each field:
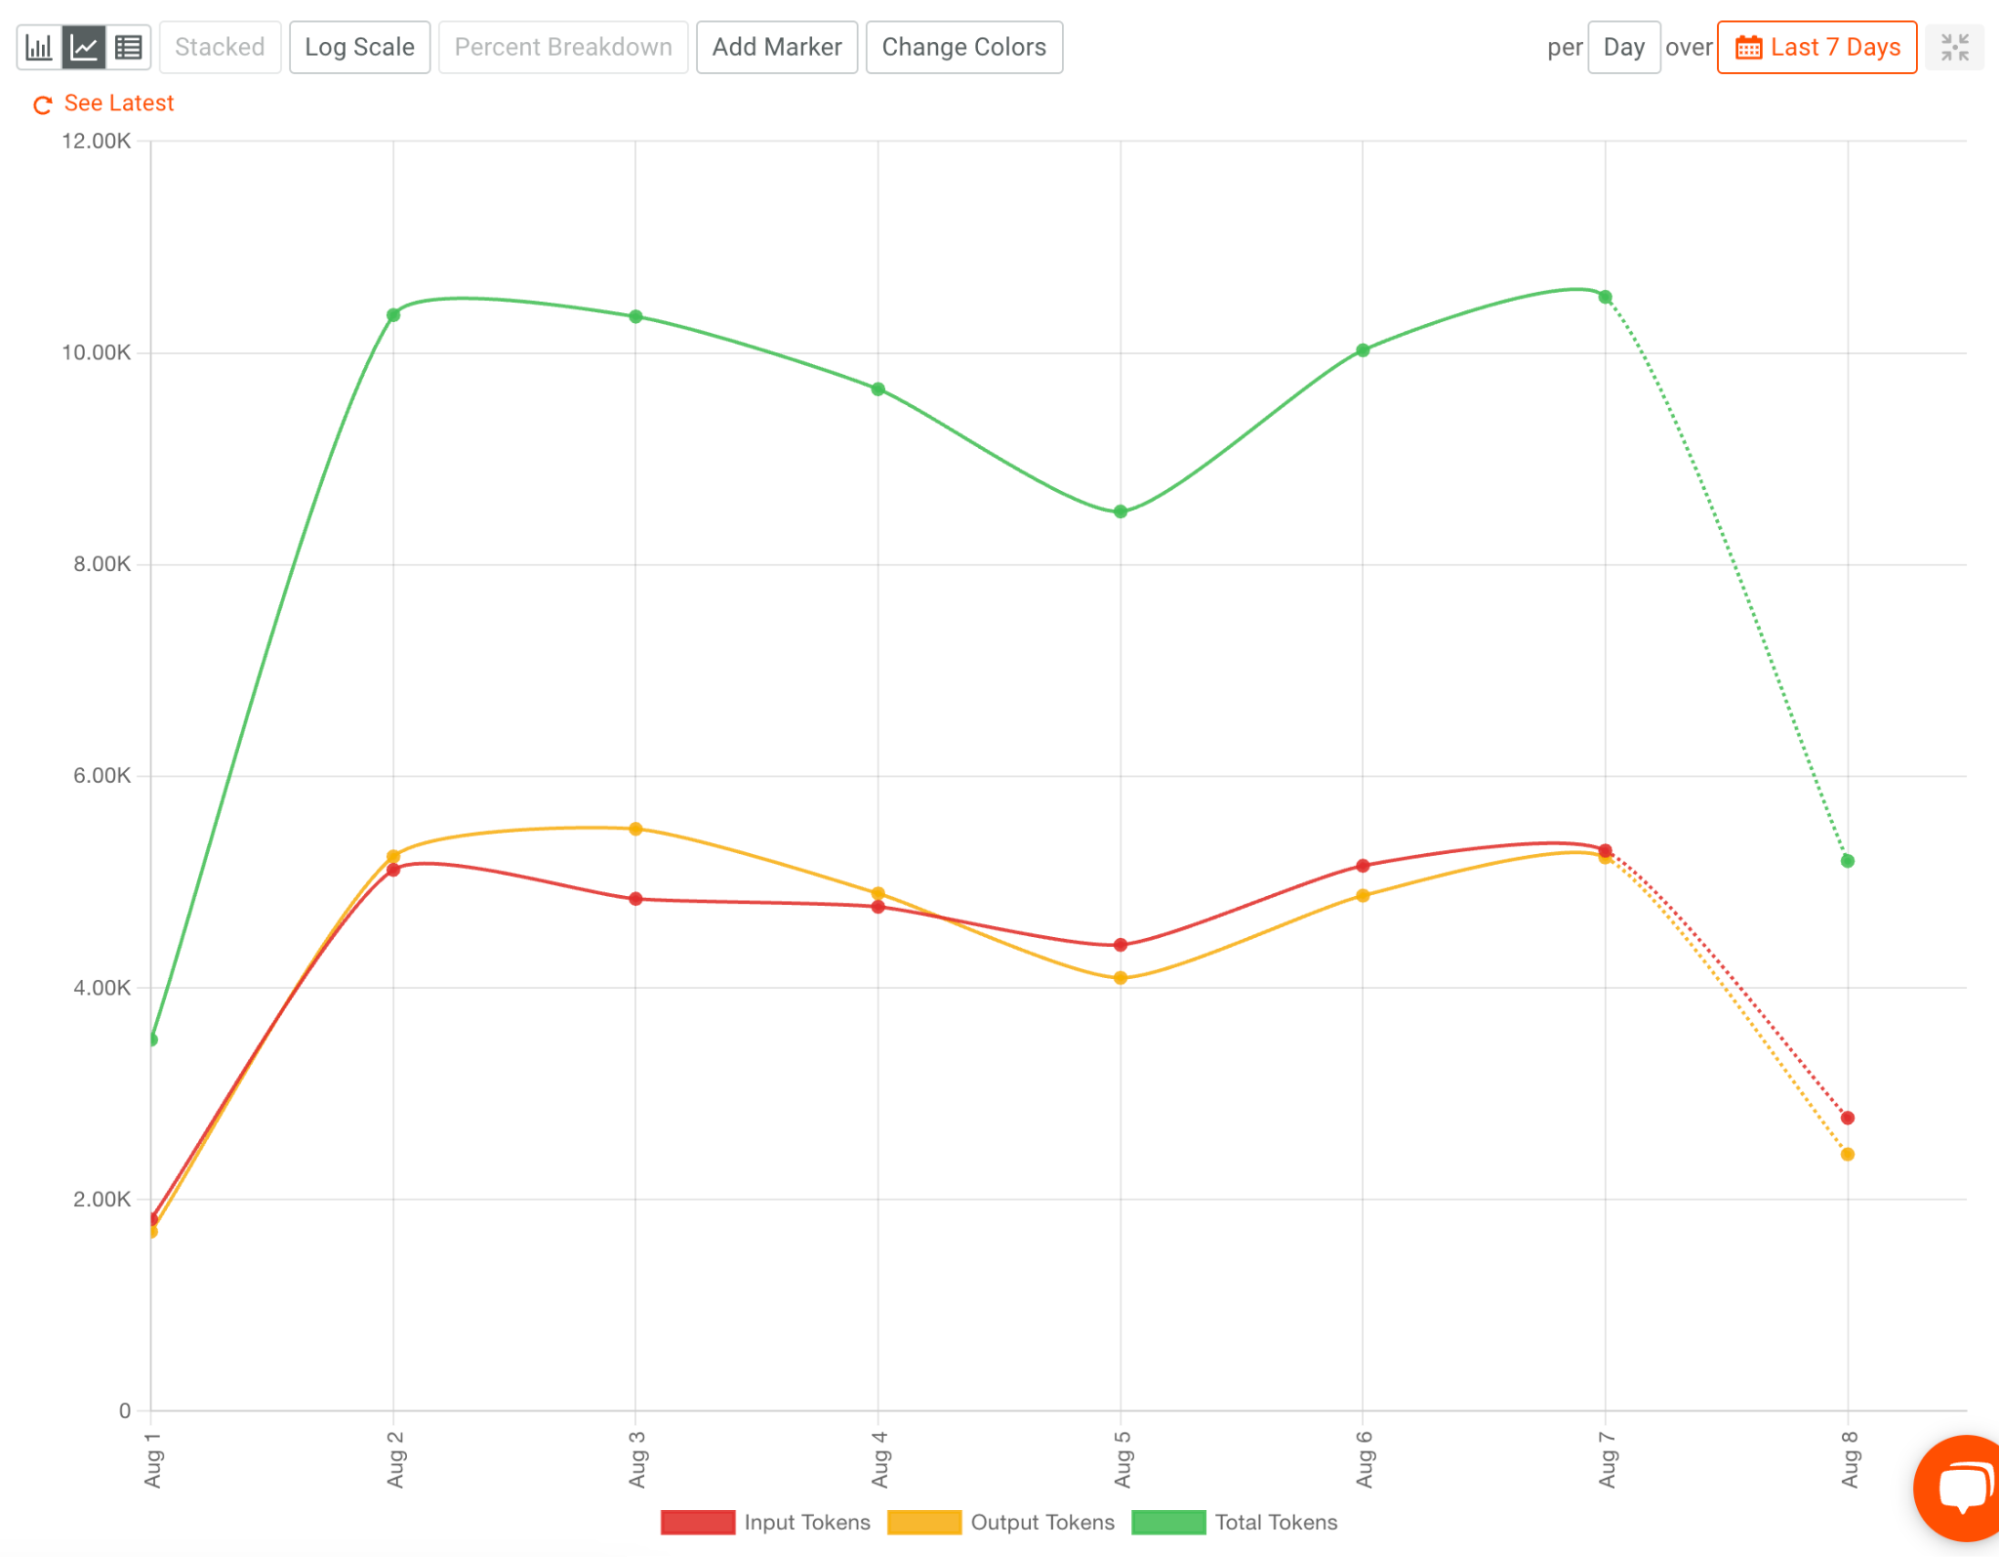
Once our chart criteria are complete, we can see the results in a line graph showing the number of input tokens, output tokens, and total tokens consumed by API users. This will allow us to understand the trends in our AI API token usage visually. The chart below shows the number of tokens used over the last seven days.
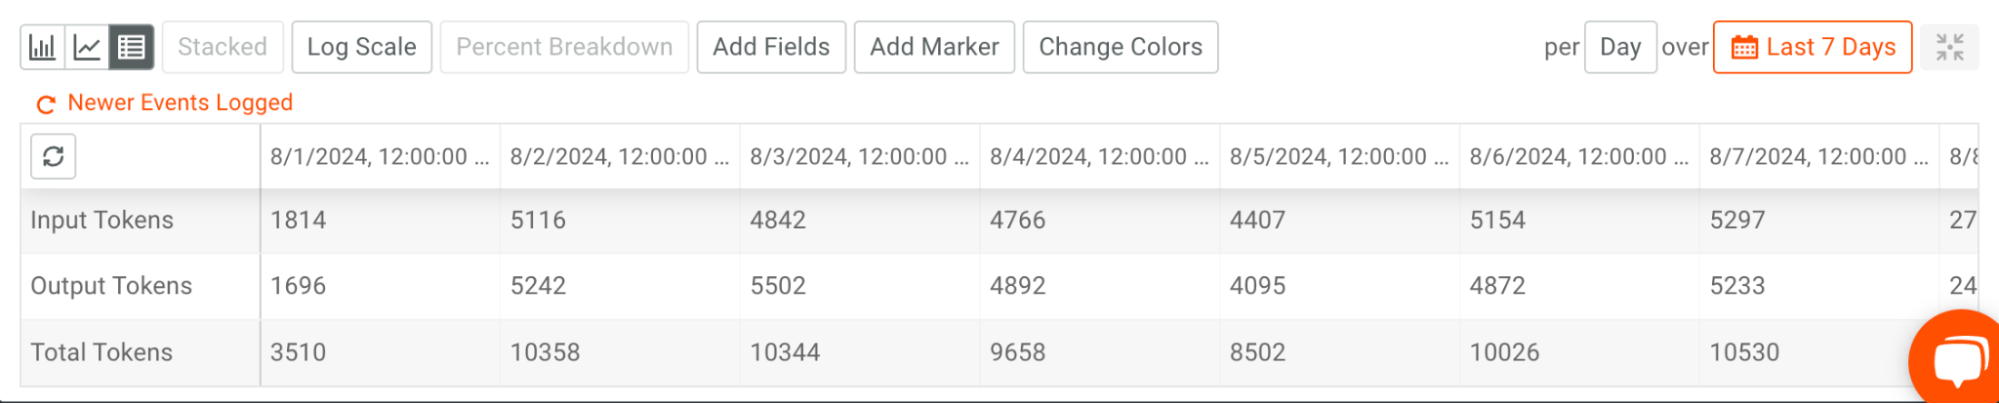
Like the other examples, these metrics can also be viewed in chart form for easier reading when it comes to the exact numbers.
With that, we’ve shown three common ways to track AI API usage within Moesif. Of course, you can explore your data further and use Moesif to monetize your APIs using the exact metrics we showed today.
Conclusion
In today’s world, understanding how your APIs are utilized is necessary. You gain valuable insights into cost management, performance monitoring, user behavior, and more by tracking your AI API usage. These insights let you make data-driven decisions, optimize your resources, and set your AI initiatives up for success.
Moesif provides you with a comprehensive platform for tracking your AI API use, providing a detailed breakdown of your API traffic. With the ability to track usage by API call, user, and token, Moesif gives you the tools to monitor, analyze, optimize, and monetize your API usage effectively.
Are you ready to take control of tracking your user’s AI API use? Sign up for Moesif today and unlock the full potential of your AI APIs.


Related Articles

API Strategy
Leveraging AI For a Better API Strategy
Learn how to leverage AI to build and fortify your API strategy. Improve design, governance, documentation, and align APIs with business outcomes.
API Strategy
The 5 Best Mixpanel Alternatives of 2025
Learn about the best Mixpanel alternatives to determine the right analytics solution for your use case.

API Development
How to Leverage Moesif Effectively for API Observability
Effectively leverage Moesif for API observability through best practices for integration, event enrichment, custom actions, and engineering workflow integrat...
API Strategy
How to Build an Internal Chargeback Model for Your API and AI Usage Using Moesif
Use Moesif to implement internal chargebacks and enable precise API and AI cost attribution for better transparency and resource optimization.
